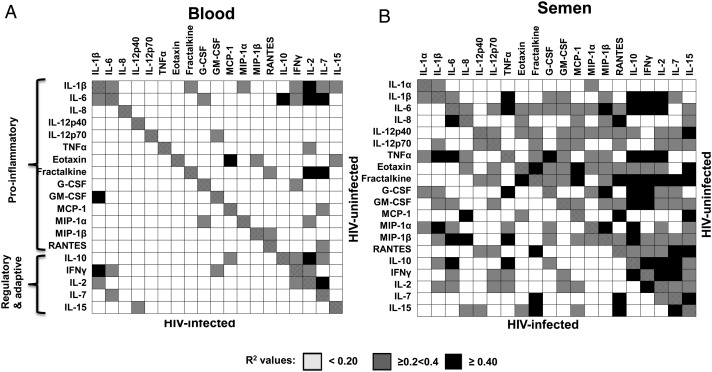
Figure 2.
Human immunodeficiency virus (HIV) infection interrupts coregulation of cytokine networks in (A) blood and (B) semen. Depicted is a table divided diagonally between HIV-uninfected (top right) and HIV-infected (bottom left) with shading representing the R2 valuesof correlations between all cytokines and chemokines assayed. Each rectangle represents an R2 value indicative of the level of correlation between each cytokine or chemokine assayed. R2 values < 0.20 = white rectangles; ≥0.2 to <0.4 = gray rectangles; ≥0.4 = black rectangles. Abbreviations: G-CSF, granulocyte colony-stimulating factor; GM-CSF, granulocyte macrophage colony-stimulating factor; HIV, human immunodeficiency virus; IFN, interferon; IL, interleukin; MCP, monocyte chemotactic protein; MIP, macrophage inflammatory protein; RANTES, regulated upon activation normal T cell expressed and secreted; TNF, tumor necrosis factor.

