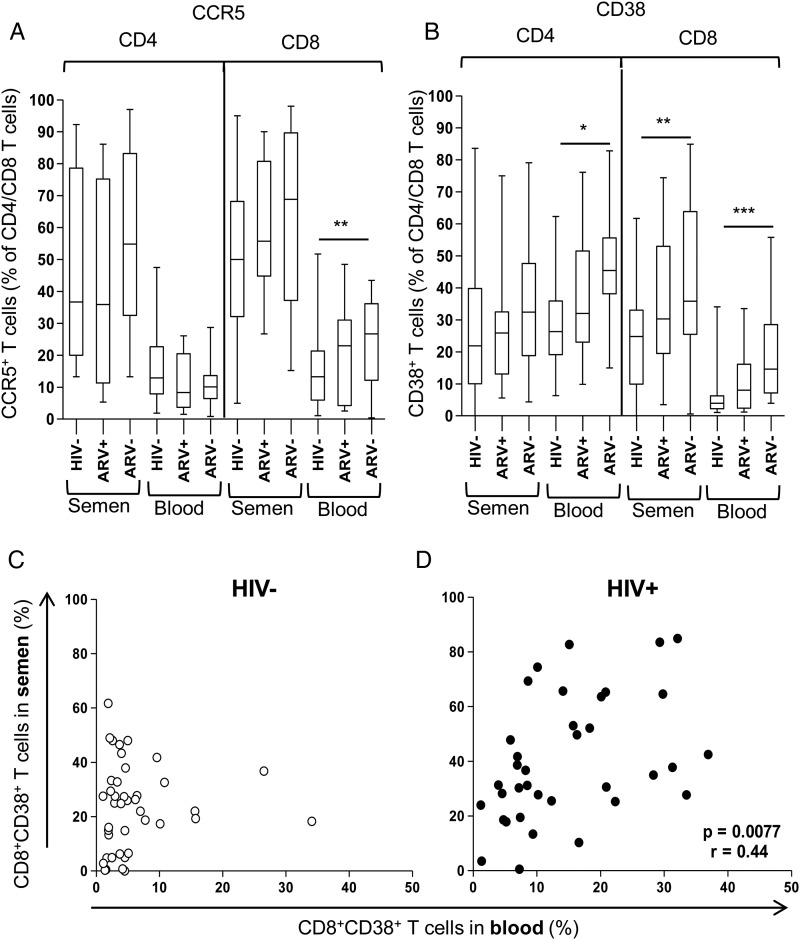
Figure 3.
Elevated activation marker expression (CD38 and CCR5) on T cells in semen compared with blood, irrespective of human immunodeficiency virus (HIV) or highly active antiretroviral therapy status. A, Frequency of CCR5+CD4+ and CD8+ T cells. B, Frequency of CD38+ CD4+ and CD8+ T cells. Each box-and-whisker plot indicates the median, interquartile range, and 10%–90% range (error bars). *, P ≤ .05; **, P ≤ .01; and ***, P ≤ .0001, using the Mann–Whitney U test for the comparison of groups, with P values ≤ .05 considered significant. C and D, Correlation of CD8+CD38+ T cells between compartments in HIV− and HIV+ men, respectively. Spearman rank test was used for correlations and P values ≤ .05 were considered significant.

