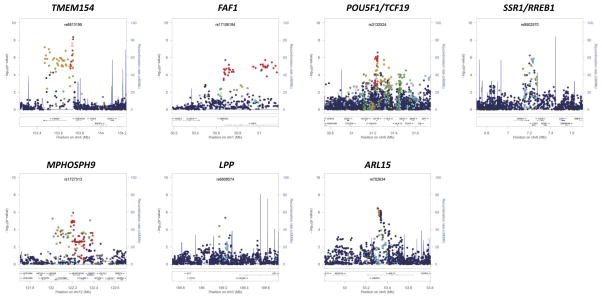
Figure 1. Signal plots of the trans-ethnic “discovery” GWAS meta-analysis for novel T2D susceptibility loci.
The trans-ethnic meta-analysis comprises 26,488 T2D cases and 83,964 controls from populations of European, East Asian, South Asian, and Mexican and Mexican American ancestry, imputed up to 2.5 million Phase II/III HapMap autosomal SNPs. Each point represents a SNP passing quality control in the trans-ethnic meta-analysis, plotted with their p-value (on a −log10 scale) as a function of genomic position (NCBI Build 36). In each panel, the lead SNP is represented by the purple symbol. The colour coding of all other SNPs indicates LD with the lead SNP (estimated by CEU r2 from Phase II HapMap): red r2≥0.8; gold 0.6≤r2<0.8; green 0.4≤r2<0.6; cyan 0.2≤r2<0.4; blue r2<0.2; grey r2 unknown. The shape of the plotting symbol corresponds to the annotation of the SNP: upward triangle for framestop or splice; downward triangle for non-synonymous; square for synonymous or UTR; and circle for intronic or non-coding. Recombination rates are estimated from Phase II HapMap and gene annotations are taken from the University of California Santa Cruz genome browser.

