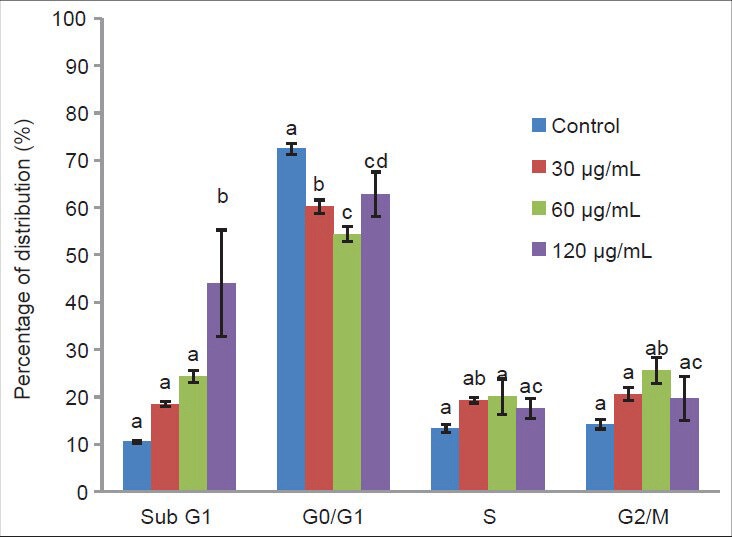
Figure 2.

Flow cytometric analysis of apoptosis (sub G1) and cell cycle distribution on the MDA-MB-231 cells treated 72 h with different concentration of Crude ethyl acetate extract from Chaetoceros calcitrans. Data represent percentage mean±standard deviation, n = 3. Data marked with alphabet are significantly different at P < 0.05, in comparison with control culture
