
Figure 4.
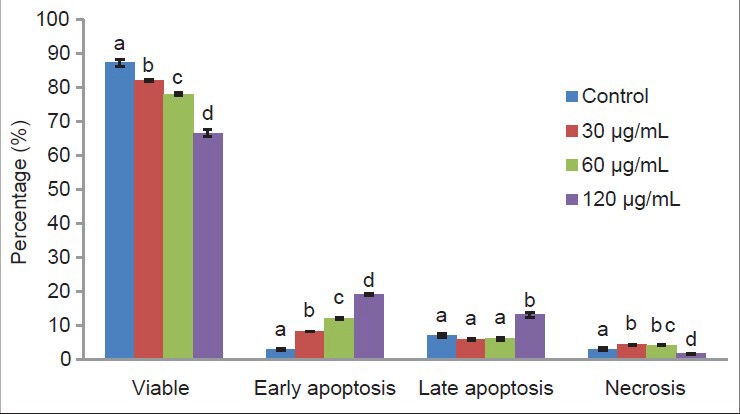
Flow cytometric analysis of phosphatidylserine-annexin V labeled on the MD Anderson-metastatic breast-231MDA-MB-231 cells treated 72 h with different concentration of Crude ethyl acetate extract from Chaetoceros calcitrans. Data represent percentage mean±standard deviation, n = 3. Data from the same group marked with different alphabet are significantly different at P < 0.05