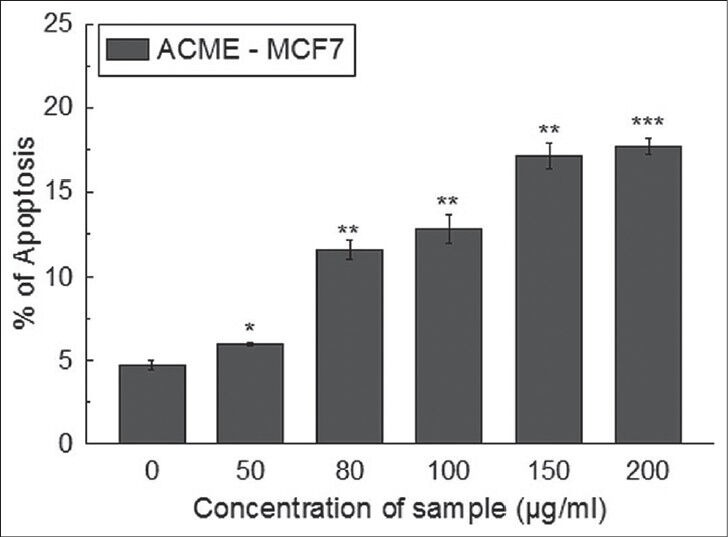
Figure 2.

Cell cycle distribution was determined in propidium iodide stained samples using flow cytometer. Percentage of cells in sub-G1 was calculated for MCF-7 cells after treatment with ACME (0-200 μg/ml) for 16 hours. All data is expressed as mean ± SD (n = 3). *P < 0.05, **P < 0.01and ***P < 0.001 vs. 0 μg/ml
