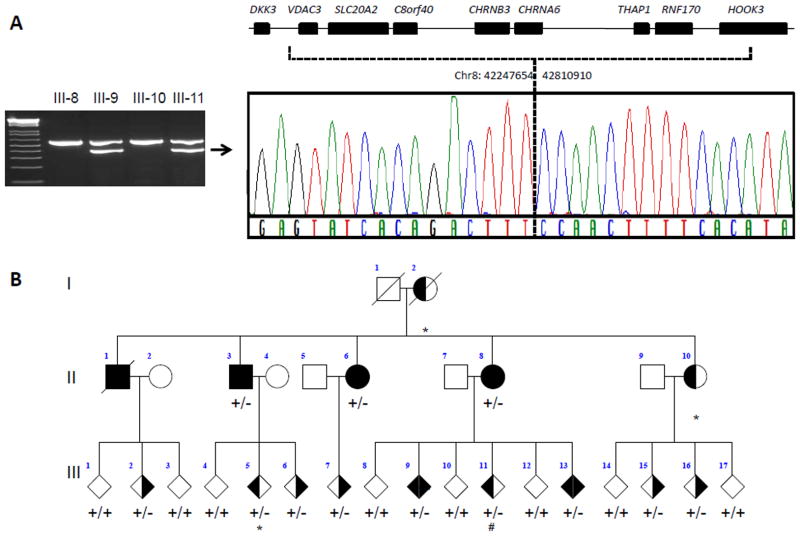
Figure 3. Segregation of chromosome 8 deletion with disease in IBGC family.
A: Agarose gel image shows duplex PCR products that confirm the presence of the deletion in a representative set of family members. The upper band (557bp) corresponds to a control fragment confirming the quality and presence of the DNA template. The lower band (361bp) is generated using primers located on each side of the deletion breakpoint based on coordinates defined by the whole-genome sequencing analysis. Sequencing analysis of the lower band using primers flanking the deletion breakpoint was performed and confirmed deletion of chr8:42247654–42810910, which includes 7 complete and one partial gene from the chromosome 8p11.21 region. B: Pedigree drawing shows segregation of the genomic deletion on chromosome 8 with disease as determined by the duplex PCR. Square represents male, circle represents female, diamond indicates disguised gender, diagonal line indicates subject is deceased, dystonia phenotype is represented by left side shading, calcifications by right sided shading, subjects with both dystonia and calcifications appear as solid, deletion shown by +/− and wild type by +/+, subject with * denote that no CT data was available. # denotes that this individual showed mild calcification in the basal ganglia which was not considered abnormal at time of CT scan.

