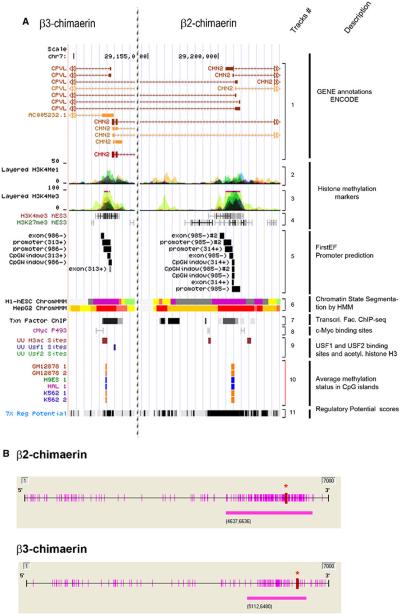
Fig. 2.
Analysis of the CHN2 gene promoter. a Putative promoter regions of β3-chimaerin (left panel) and β2-chimaerin (right panel) (UCSC Genome Browser). Track #1 CHN2 gene plot; Track #2, enhancer- and promoter-associated histones marks, H3K4Me1, from 9 human cell lines; Track #3, promoter-associated histones marks, H3K4Me3, from 8 human cell lines; Track #4, GIS ChIP-PET showing H3K4me3 and H3K27me3 histone modifications from 4 human cell lines; Track #5, first-exon promoter prediction; Track #6, ENCODE chromatin state segmentation by HMM from Broad Institute of 2 human cell types (Bright Red active promoter/Light Red weak promoter/Purple inactive-poised promoter/Orange strong enhancer/Yellow weak-poised enhancer/Light Green weak transcribed/Gray polycomb-repressed/Light Gray heterochromatin); Track #7, ENCODE transcription factor ChIP-seq; Track #8 GIS ChIP-PET: binding sites for c-Myc; Track #9, Uppsala University ChIP-chip Signal, showing localization of transcription factors (USF1 and USF2) and acetylated histone H3 (H3ac) in a liver cell line (HepG2); Track #10 ENCODE HudsonAlpha CpG methylation showing methylation status of specific CpG dinucleotides in 3 human cell types (orange = methylated; blue = unmethylated); Track #11 ESPERR regulatory potential (RP) compare frequencies of known regulatory elements and neutral DNA from 7 species. b CpG sites (purple bars along the axis) and CpG islands (purple bars below the axis) near β2-chimaerin and β3-chimaerin promoter regions. Red asterisks indicate translation start sites (ATGs). (Color figure online)

