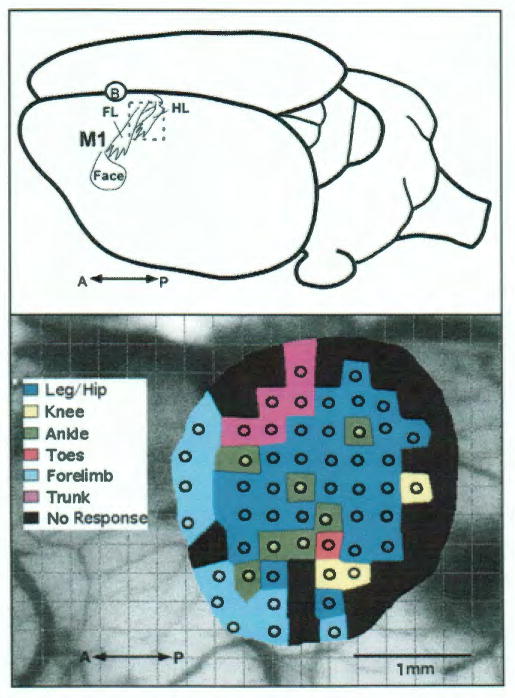
FIG. 1.
Top: Schematic diagram of a dorsolateral view of the rat brain showing the location of the hindlimb representation (HL) relative to the forelimb (FL) and face representations in primary motor cortex (M1) of the left hemisphere. The circled B indicates the position of Bregma on the dorsal surface of the skull at midline over the longitudinal convexity. Bottom: Results of ICMS mapping of the hindlimb representation in the left hemisphere in a representative F344 rat (R33). Circles represent the location of microelectrode penetrations and colors represent the movement evoked by near-threshold electrical stimulation (<70 μA). In this rat the total hindlimb area measures 2.51 mm2. A = anterior; P = posterior.

