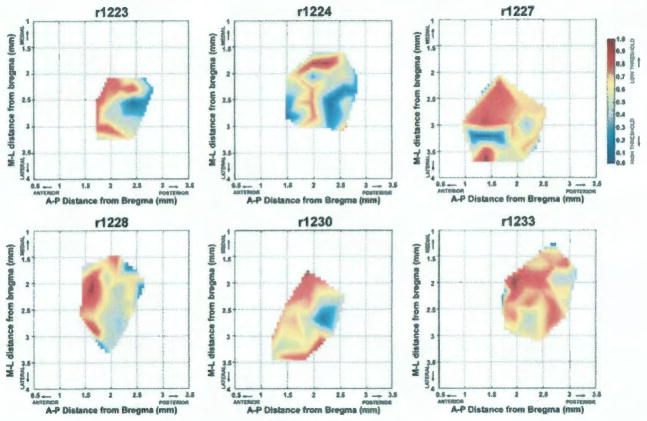
FIG. 3.
Graphical distribution of minimum currents required to evoke hindlimb movements (movement thresholds) in each of the six rats. Current values for each map were normalized across the range of currents from minimum to maximum, such that minimum (lowest) thresholds = 1 and appear in red and the maximum (highest) thresholds = 0 and appear in blue. A MatLAB® algorithm was used to interpolate values to create a continuous distribution. M= medial; L= lateral; A= anterior; P= posterior

