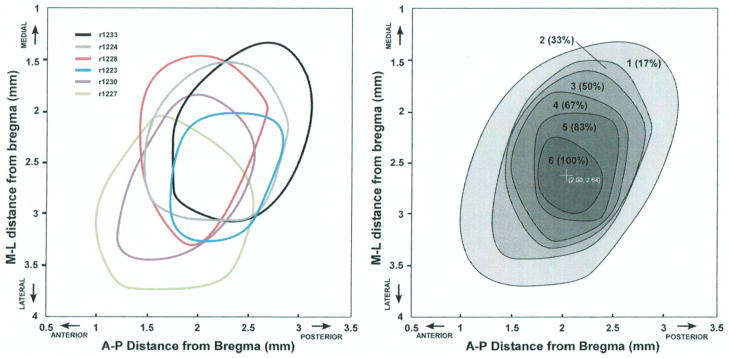
FIG. 4.

Left: Overlay of hindlimb representation borders relative to Bregma for each rat. Borders are derived from movement maps illustrated in Figure 1–2, and are created by a smoothing algorithm based on locations of individual boundary sites (Canvas, ACD Systems). Right: Hindlimb probability map showing the degree of overlap of hindlimb representations in the sample of six rats. Greyscale and numbers indicate the number of rats with hindlimb representation at a particular stereotactic location. The darkest region (6) represents the territory in which hindlimb movements are evoked in all six rats (100%). The center of the overlap region is located at 2.00 mm posterior and 2.64 mm lateral to Bregma. M= medial; L= lateral; A= anterior; P= posterior.
