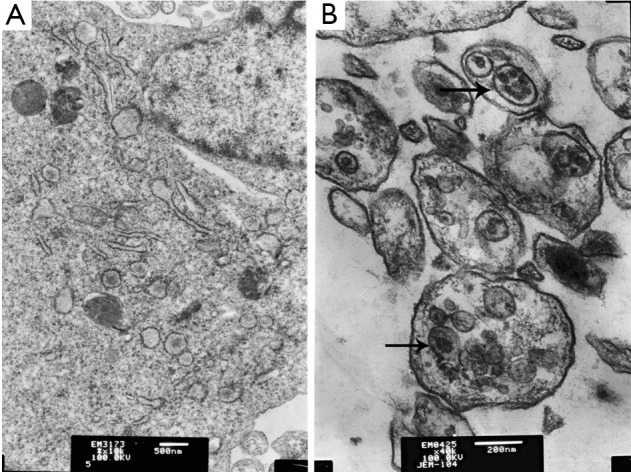
Figure 3.

Transmission electron images of HepG2 cells treated with 10,000 IU/mL IFN-α2b. The arrowhead indicates single- or double-membrane vesicles containing intact and degraded cellular debris. (A) Control; (B) Cells treated with 10,000 IU/mL IFN-α2b.
