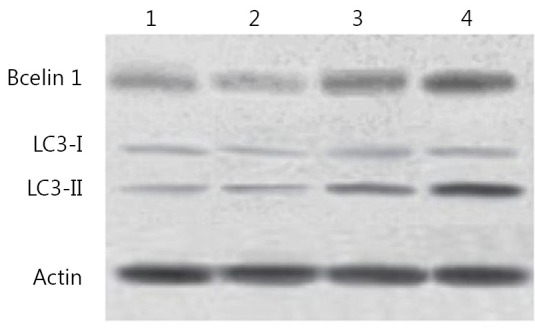
Figure 4.

Modification of LC3 and Bcelin1 in HepG2 cells after treatment with IFN-α2b. 1, control group; 2, cells treated with 100 IU/mL IFN-α2b; 3, cells treated with 1,000 IU/mL IFN-α2b; 4, cells treated with 10,000 IU/mL IFN-α2b.

Modification of LC3 and Bcelin1 in HepG2 cells after treatment with IFN-α2b. 1, control group; 2, cells treated with 100 IU/mL IFN-α2b; 3, cells treated with 1,000 IU/mL IFN-α2b; 4, cells treated with 10,000 IU/mL IFN-α2b.