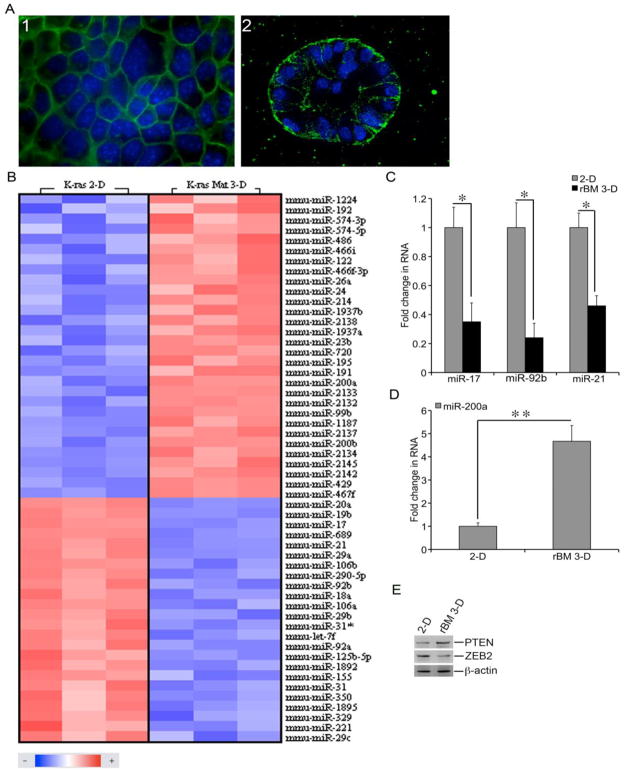
Figure 1.
Distinct miRNA profiles of mK-ras-LE cells in 2-D and rBM 3-D cultures. A) mK-ras-LE cells were grown in 2-D and rBM 3-D culture. Morphology of the cells was visualized using fluorescent staining for F-actin. The images of rBM 3-D culture were captured at the central planes of cell clusters using a confocal fluorescent microscope on day 12 post-seeding. The images were captured at 600x magnification. Representative images of each culture condition were displayed. B) Total cell RNA was extracted from mK-ras-LE cells in 2-D and rBM 3-D cultures. miRNA expression profiles were compared between the two culture conditions using miRNA microarrays. A heatmap of the significantly differentially expressed miRNAs was generated using geWorkbench suite (n = 3, P < 0.01, FDR < 0.05). C) The expression of miR-17, miR-92b, and miR-21 was measured using qRT-PCR in total cell RNA collected from 2-D and rBM 3-D cultures of mK-ras-LE cells. A fold change of each miRNA of interest was obtained by setting the values of each miRNA in 2-D culture to one and normalization to the values of U6. D) Similar to part C except that the expression of miR-200a was compared between 2-D and rBM 3-D cultures. E) The culture conditions were similar to part A. The cell lysates were collected from the cell colonies extracted from the culture. The protein levels of ZEB2, PTEN, and -actin were determined using immunoblots. The data were presented in averages and standard deviations obtained from three independent experiments. and indicated a P value < 0.05 and 0.01, respectively.

