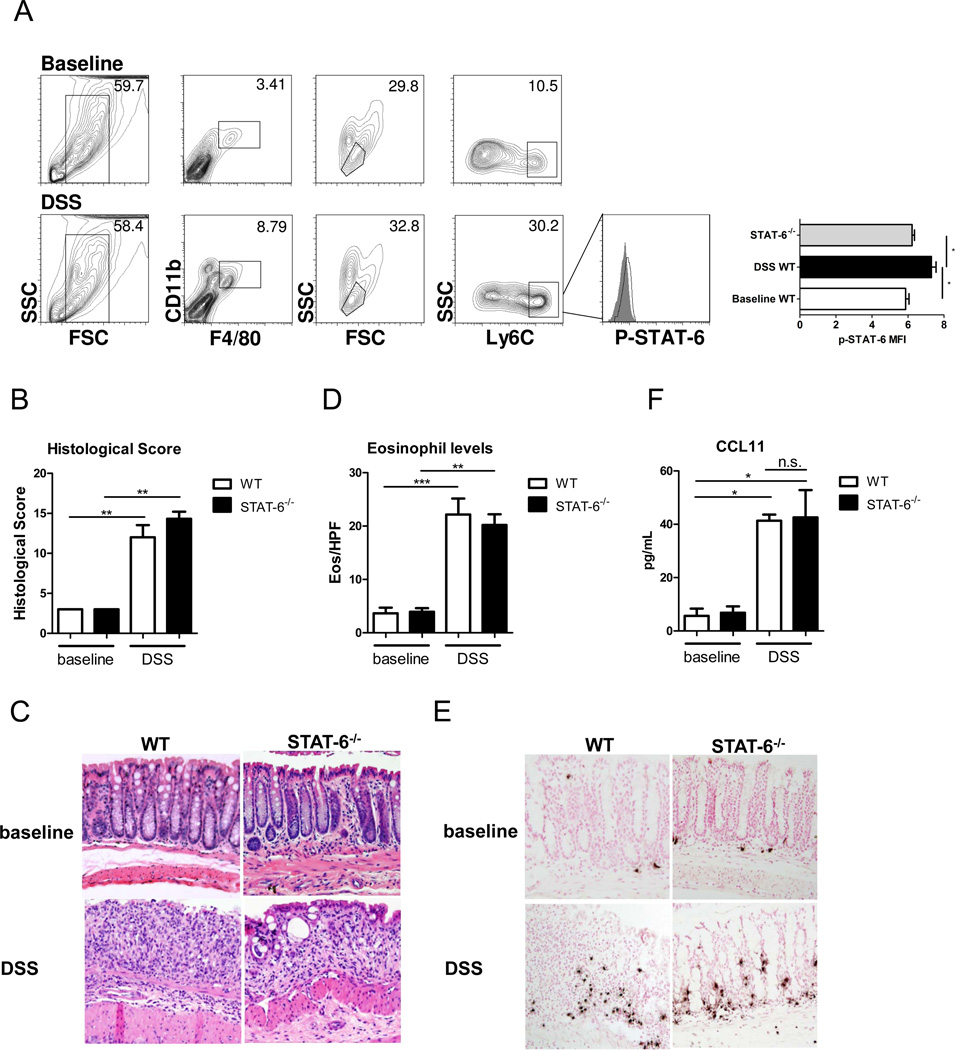
Figure 1. Eosinophil recruitment and CCL11 expression are STAT-6-independent in DSS-induced colitis.
A, Representative flow cytometry plots of F4/80+CD11b+Ly6Chi colonic MΦs and representative histograms of phospho-STAT-6 expression in DSS-treated WT mice (open histogram) compared to STAT-6−/− mice (filled histogram) and mean fluorescence intensity of phospho-STAT-6. B, Histological score. C, Representative photomicrographs of H&E-stained colonic sections from baseline and DSS-treated mice (day 7, 2.5% DSS). D, Eosinophil levels in the colon and E, representative photomicrographs of anti-MBP-stained colonic sections from baseline and DSS-treated mice (day 7, 2.5% DSS). F, CCL11 levels in punch biopsy supernatants from WT and STAT-6−/− mice at baseline and following 5 days of DSS. (A). Data represents the mean ± SEM of n = 3–7 mice per group from duplicate experiments. (B-F) Data represents the mean ± SEM of n = 5–6 mice per group. Data is representative of triplicate experiments. Significant differences (*p<0.05; **p<0.01; ***p<0.001) between groups.

