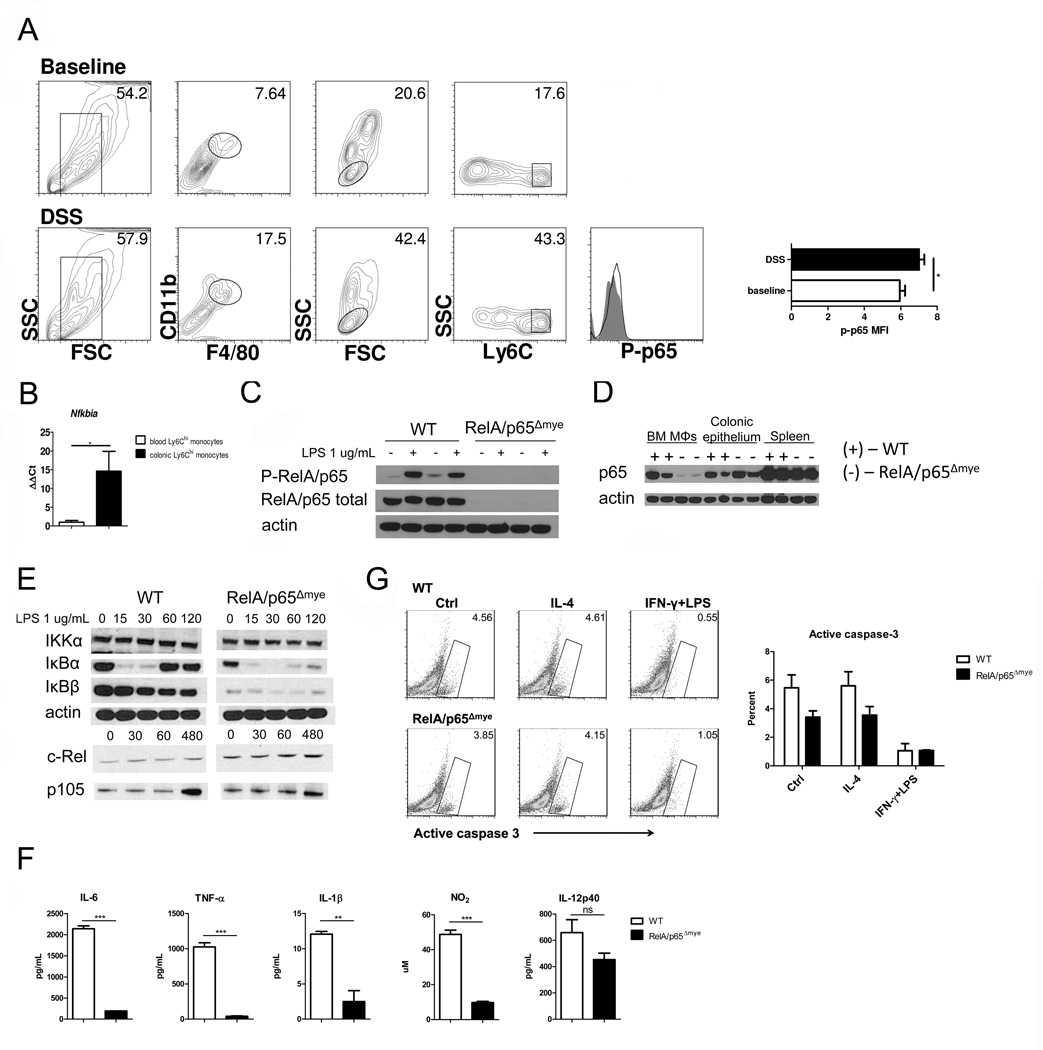
Figure 2. Specificity of RelA/p65 deletion in RelA/p65Δmye mice.
A, Representative flow cytometry plots and histograms of phospho-RelA/p65 expression in F4/80+CD11b+Ly6Chi colonic MΦs from DSS-treated WT (open histogram) and RelA/p65Δmye mice (filled histogram). B. Quantification of Nfkbia expression from Ly6Chi MΦs/monocytes sorted from the peripheral blood or colon of DSS-treated mice. Data represent the mean ± SEM of n = 5 mice per group. Representative western blot analysis of WT (+) and RelA/p65Δmye (−) (C) BMDMs stimulated with 1 ug/mL LPS for 1 hour, (D), colonic epithelium and spleen of total RelA/p65 and/or phospho-RelA/p65. E, representative western blot analysis of IKKα, IκBα, IκBβ, c-Rel, p105 and actin expression in BMDMs stimulated with LPS for indicated times (minutes). F, WT and RelA/p65Δmye BMDMs were stimulated for 24 hours with vehicle or 1 ug/mL LPS and levels of IL-6, TNF-α, IL-1β, NO2 and IL-12p40 were measured in the supernatants. G, Representative flow cytometry plots and graph of BMDMs stimulated for 24 hours with control, IL-4 or IFN-γ + LPS and assessed for active caspase-3. (F and G) Data represent the mean ± SEM of n = 3 individual samples per group. (A, C, E–G) Data is representative of duplicate experiments. Significant differences (*p<0.05**, p < 0.01; ***p < 0.001) between groups.

