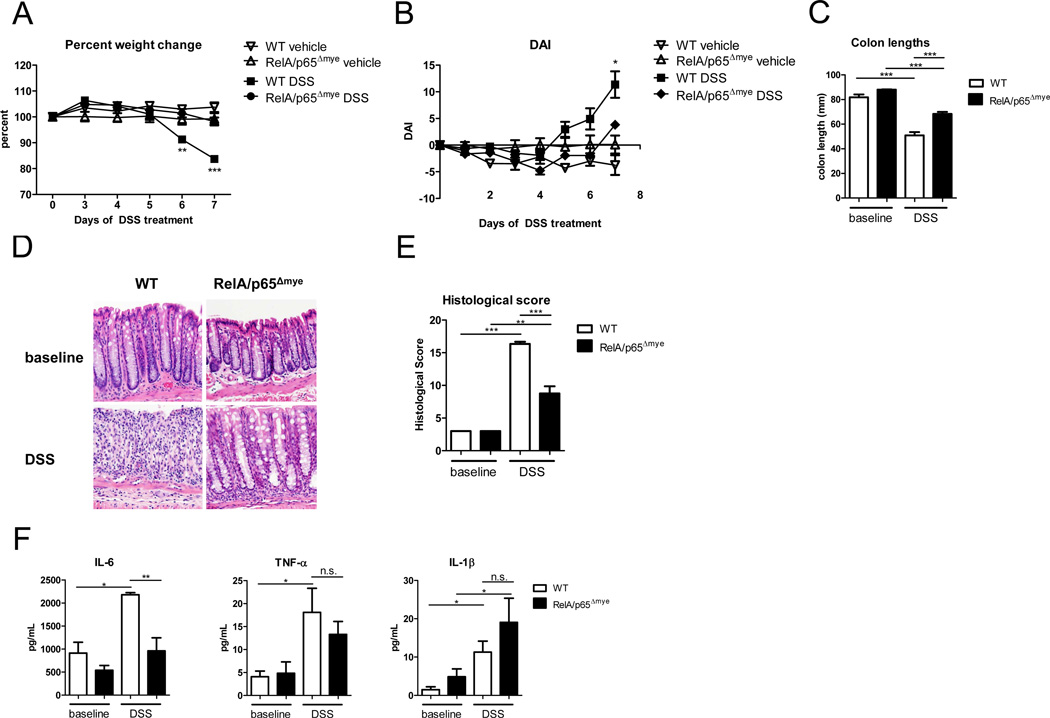
Figure 3. DSS-induced colitis is attenuated in RelA/p65Δmye mice.
A, Percent weight change and (B) Disease activity index (DAI) of WT and p65Δmye mice following DSS exposure. C, colon lengths D, representative photomicrographs and (E) quantitative histological score of H&E-stained colonic sections from of WT and p65Δmye mice following 7 days of DSS exposure. F, Cytokine Profile of colonic punch biopsy samples from WT and p65Δmye mice following DSS-exposure. Data represent the mean ± SEM of n = 3–5 mice per group. Data is representative of triplicate (A–E) and duplicate (F) experiments. Significant differences (*p < 0.05; **p < 0.01; ***p < 0.001) compared with WT vehicle or as indicated. Magnification of photomicrographs is ×100. n.s. – not significant.

