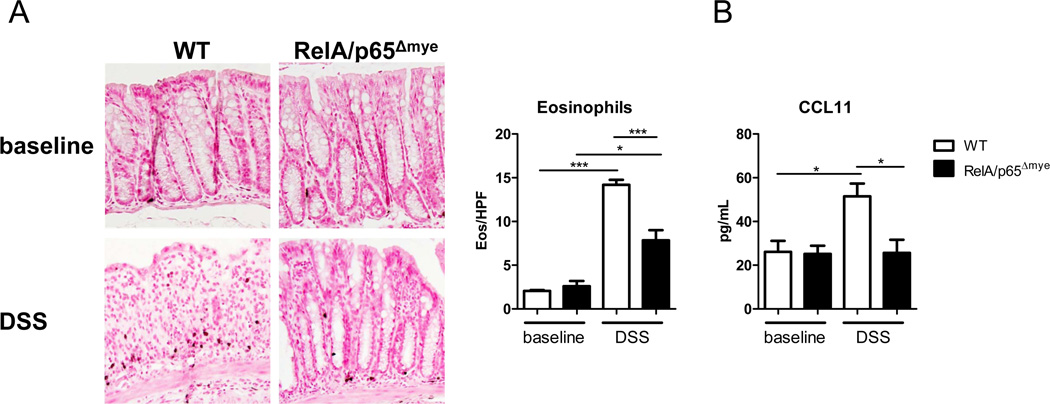
Figure 5. Lack of induction of CCL11 and eosinophils in RelA/p65Δmye mice during DSS-induced colitis.
A, Representative photomicrographs of anti-MBP-stained colonic sections from baseline and DSS-treated mice (day 6, 2.5%) and colonic eosinophil levels in the colon. B, CCL11 levels in punch biopsy supernatants from WT and RelA/p65Δmye mice in vehicle- (baseline) and DSS-treated mice (day 5, 2.5%) Data indicates the mean ± SEM of n = 6–8 mice per group from triplicate experiments. Significant differences (*p < 0.05; ***p < 0.001) between groups. Magnification of photomicrographs is ×100.

