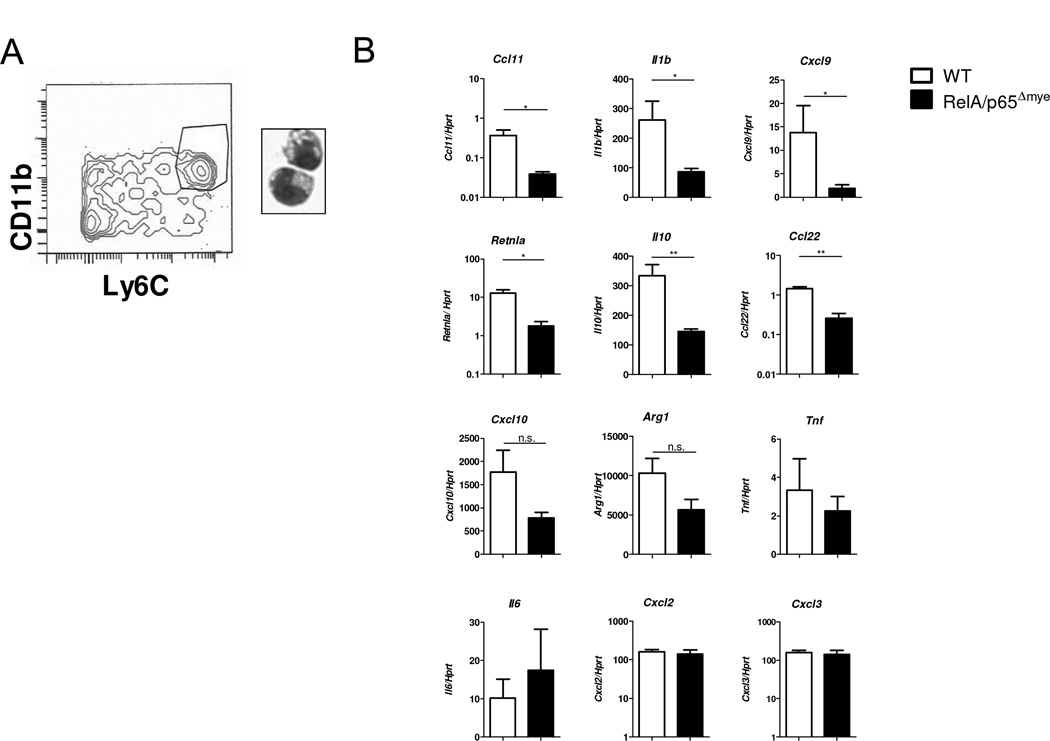
Figure 6. Phenotype Ly6Chi colonic MΦs in WT vs. RelA/p65Δmye mice during DSS-induced colonic injury.
A, Representative flow cytometry plot of CD11b+Ly6Chi colonic MΦs flow sorted on day 5 of DSS treatment. B, gene expression was analyzed by qRT-PCR. 3–4 mice were pooled per sample from DSS-treated WT and RelA/p65Δmye mice (3–4 samples per group). Data represents the mean ± SEM. Data is representative of duplicate experiments. Significant differences (*p < 0.05; **p < 0.01) between groups. n.s. – not significant.

