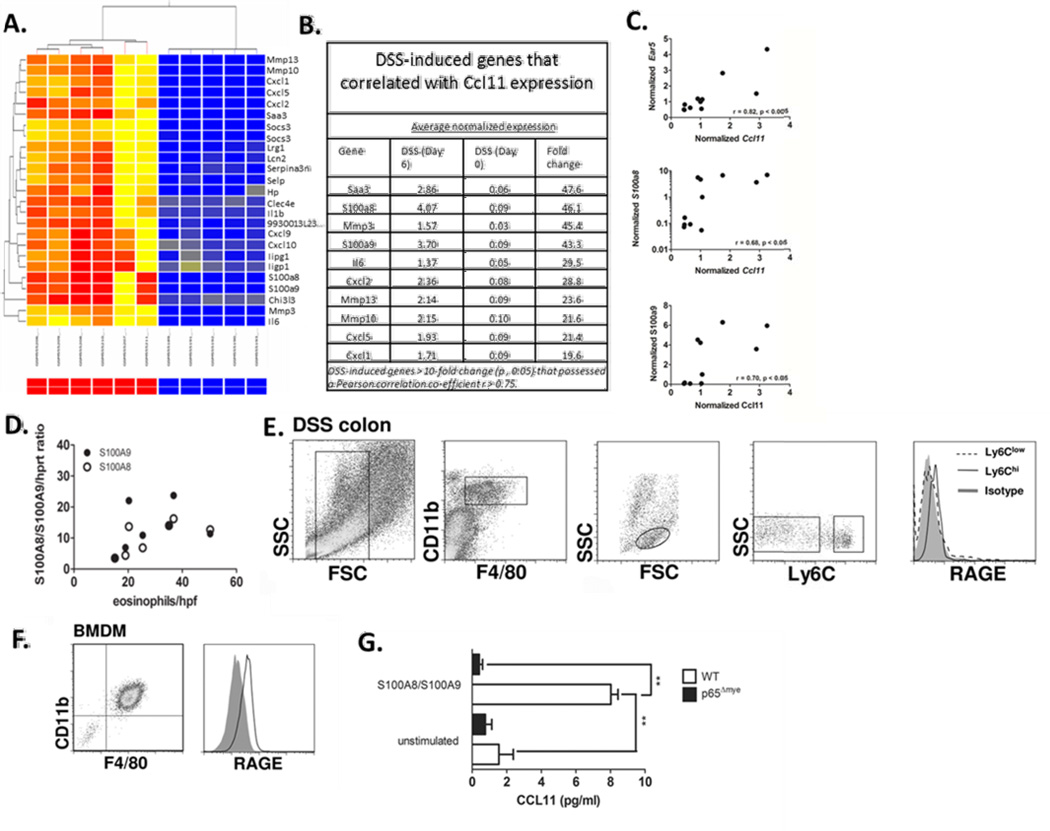
Figure 7. Relationship between eosinophil-specific gene (Ear5), Ccl11 and Calprotectin (S100a8 and S100a9) expression in DSS-induced colitis.
A. Heat map showing the clustering of the top 25 differentially-expressed genes following DSS-induced colitis (day 6 vs. day 0, p < 0.05). B. Top 10 differentially-expressed genes following DSS-induced colitis (day 6 vs. day 0, p < 0.05, fold change > 10) that correlated with Ccl11 expression (r > 0.75). C. Pearson product-moment correlation between normalized microarray expression values of Ear5, S100a8 and S100a9 are plotted against Ccl11 from individual animals. (D) Pearson product-moment correlation between S100a8 and S100a9/Hprt ratio and eosinophils/hpf in the colon of WT C57BL6 mice on day 3, 5 and 7 after DSS exposure. E. Representative flow plots of RAGE expression on (E.) colonic F4/80+ CD11b+ Ly6Chi monocytes/MΦ from DSS-treated mice and (F.) BMMΦ. G. CCL11 levels in supernatants from WT and RelA/p65Δmye BMMΦ following 24 hour stimulation with S100a8/S100a9 complex. G. Data represents the mean ± SEM. Data is representative of duplicate experiments. Significant differences (**p < 0.01) between groups.

