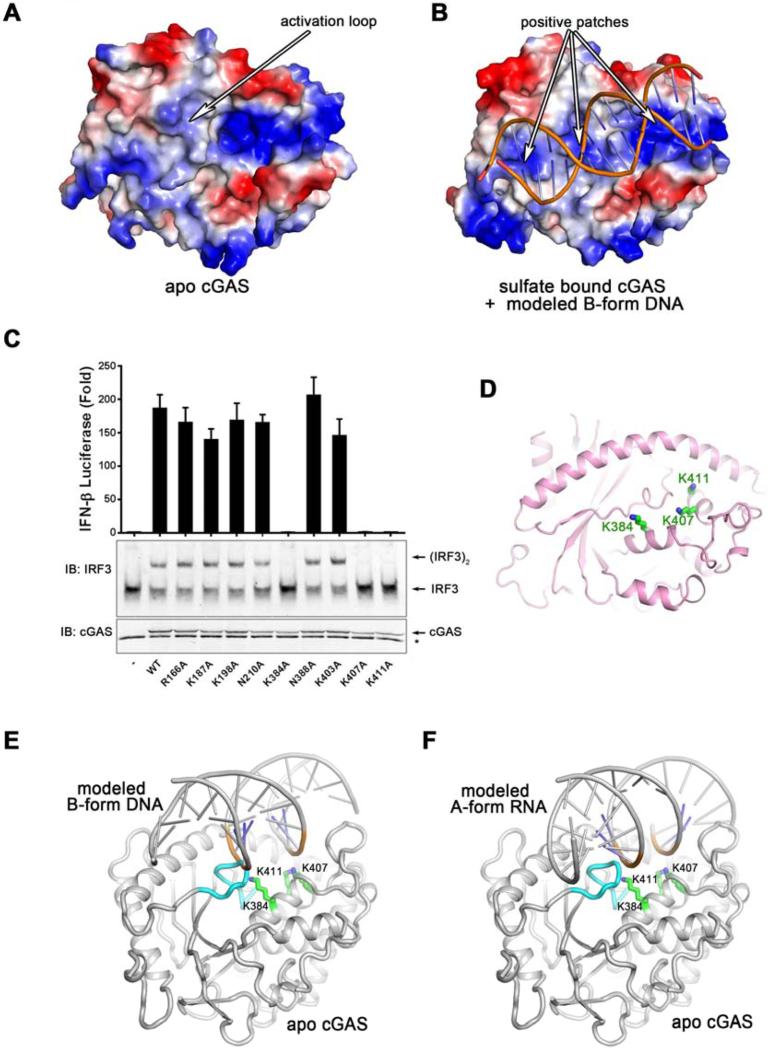
Figure 3. The primary DNA-binding surface of cGAS is essential for IFNβ induction.
(A and B) The electrostatic representations of apo cGAS (A) and sulfate bound cGAS (B). A series of positively charged patches in sulfate bound cGAS indicate the potential primary DNA binding surface. (C) Expression plasmids encoding WT and various mutants of human cGAS fragments (161-522) containing alanine substitutions of positively charged residues shown in (B) were transfected into HEK293T-STING-IFNβ luciferase reporter cells followed by luciferase assays to measure IFNβ induction. Aliquots of the cell extracts were immunoblotted with an IRF3 antibody following native gel electrophoresis (middle panel) or with a cGAS antibody flowing SDS-PAGE (bottom panel). The error bars represent variation ranges of duplicate experiments. (D) Functionally important positively charged residues, shown in green sticks, are located in the center of the primary binding surface. (E and F) Docking B-form DNA to apo cGAS (E) results in a steric clash between the activation loop and the DNA, which likely triggers the inward movement of the activation loop (E). However, docking A-form RNA to apo cGAS does not reveal the steric clash or the movement of the activation loop (F). The activation loop is colored in cyan. Loss-of-function mutations on the primary DNA binding surface are shown in sticks and colored in green.

