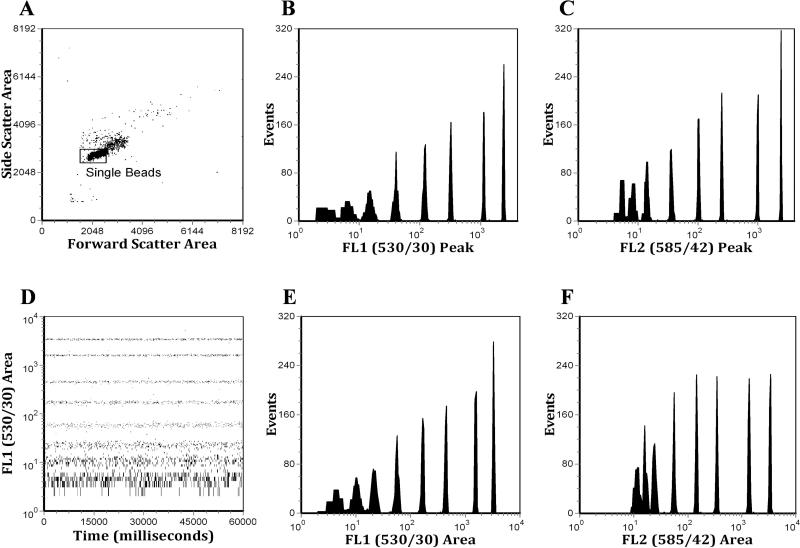
Figure 3.
Eight peak Rainbow microsphere data analyzed on a FACSCalibur using a four-channel demonstration system. A. A bivariate histogram of side-scatter versus forward-scatter, showing the gate, which is applied to the other histograms in this figure. B. Peak histogram from the FL1 detector using linear amplification. C. Peak histogram from the FL2 detector using linear amplification. D. A bivariate histogram showing the time parameter which was set to 1 millisecond resolution. E. Area histogram from the FL1 detector. F. Area histogram from the FL2 detector.

