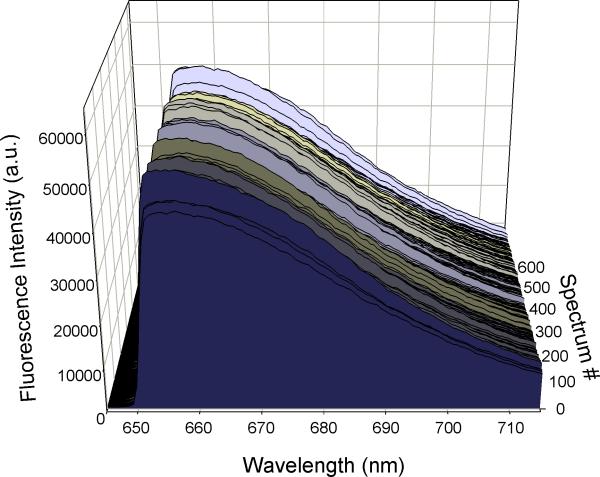
Figure 6.
The demonstration system triggers an external CCD detector for spectral flow cytometry measurements. Nile Blue microspheres were analyzed on a custom spectral flow cytometer. Light scatter pulses were used to trigger correlated spectral data acquisition by a CCD. Data was gated to eliminate debris and aggregates, and spectra from more than 500 individual fluorescent microspheres are displayed.

