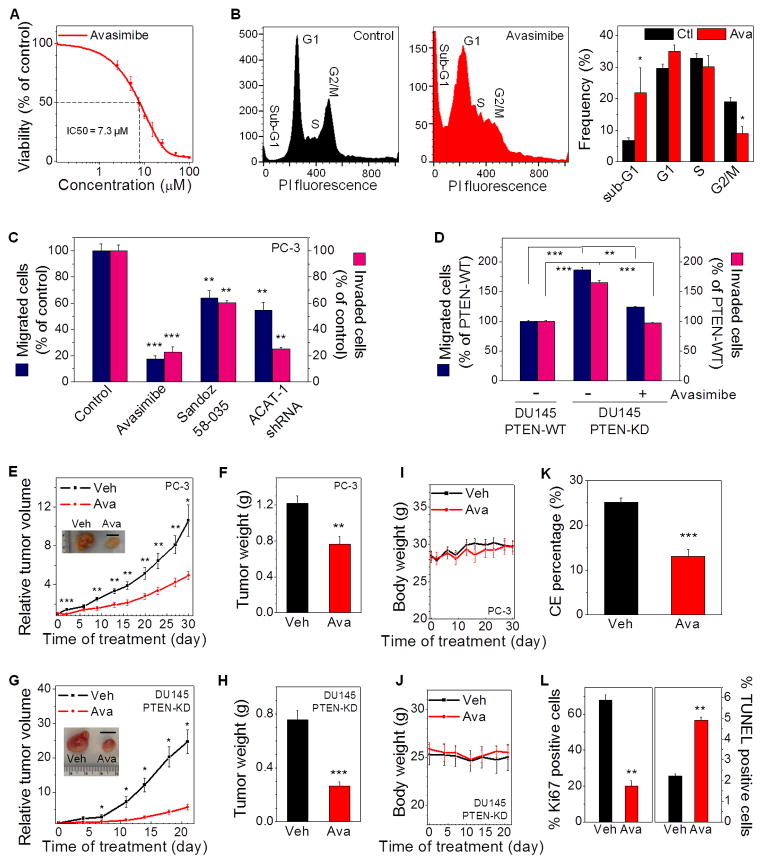
Figure 5. CE depletion impairs PCa aggressiveness.
(A) IC50 curve of avasimibe treatments (3 day) on PC-3 cells (IC50 = 7.3 μM). n = 6. The control group (DMSO) was used for normalization. (B) Flow cytometry analysis of cell cycle in control and avasimibe-treated (7.5 μM, 3 day) PC-3 cells (n = 3). PI: propidium iodide. (C) Quantitation of migrated and invaded PC-3 cells that were pretreated with avasimibe (5 μM), Sandoz 58-035 (10 μM), or ACAT-1 shRNA for 2 days (n = 3). The control group was used for normalization. (D) Quantitation of migrated and invaded PTEN-WT or PTEN-KD DU145 cells that were pretreated with DMSO as control or avasimibe (5 μM) for 1 day (n = 3). The PTEN-WT DU145 group was used for normalization. (E) Relative tumor volume of PC-3 xenograft (n = 9) upon daily avasimibe treatments (15 mg/kg). Representative tumors harvested on day 30 are shown in the inset. Scalar bar, 1 cm. (F) Weight of tumor tissues harvested from vehicle and avasimibe-treated mice in (E). (G) Relative tumor volume of PTEN-KD DU145 xenograft (n = 8). Representative tumors harvested on day 21 are shown in the inset. Scalar bar, 1 cm. (H) Weight of tumor tissues harvested from vehicle and avasimibe-treated mice in (G). (I, J) Body weight of the mice bearing PC-3 tumors (n = 9) (I), and PTEN-KD DU145 tumors (n = 8) (J). (K) CE percentage and (L) Percentage of Ki67 and TUNEL positive cells in tumor tissues harvested from vehicle and avasimibe-treated mice in (E) (n = 5). Ctl: control, Veh: vehicle, Ava: avasimibe, WT: wild-type, KD: knockdown. Error bars represent SEM. *: p < 0.05, **: p < 0.005, ***: p < 0.0005.

