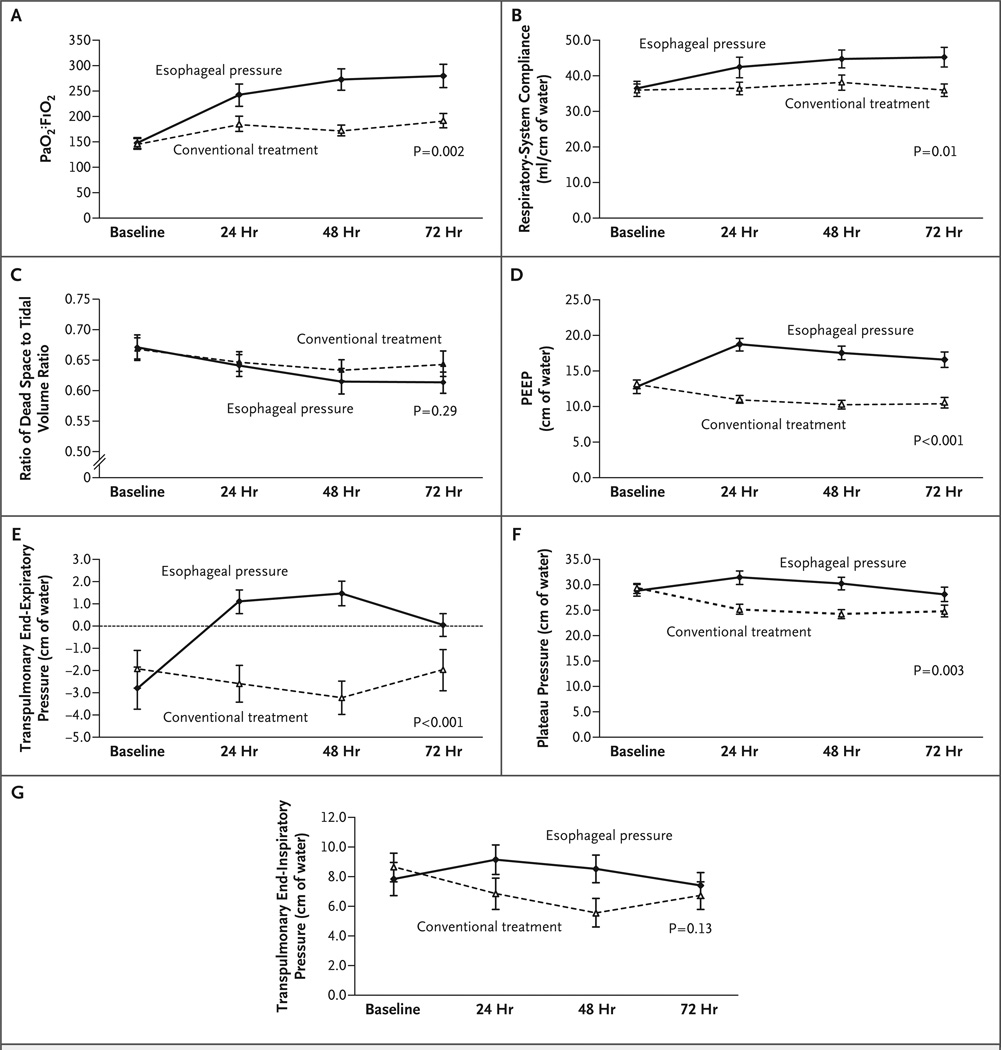
Figure 2. Respiratory Measurements at Baseline and at 24, 48, and 72 Hours in the Control and Esophageal-Pressure–Guided Groups.
Means and standard errors are shown. P values were calculated by repeated-measures analysis of variance. Panel A shows the ratio of the partial pressure of arterial oxygen to the fraction of inspired oxygen (PaO2:FiO2), Panel B respiratory-system compliance, Panel C the ratio of dead space to tidal volume, Panel D positive end-expiratory pressure (PEEP), Panel E transpulmonary end-expiratory pressure, Panel F plateau pressure, and Panel G transpulmonary end-inspiratory pressure.

