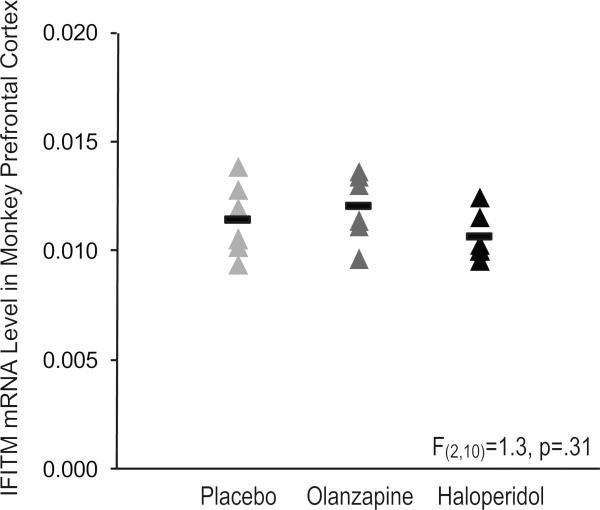
Figure 2. IFITM mRNA levels in prefrontal area 9 of antipsychotic-exposed monkeys.
Quantitative PCR analysis revealed no statistically significant differences in IFITM mRNA levels (mean ± standard deviation) in monkeys chronically exposed to either olanzapine (0.0120 ± 0.0016; dark gray triangles) or haloperidol (0.0107 ± 0.0011; black triangles) compared to placebo (0.0115 ± 0.0017; light gray triangles). Mean values are shown as horizontal black bars.

