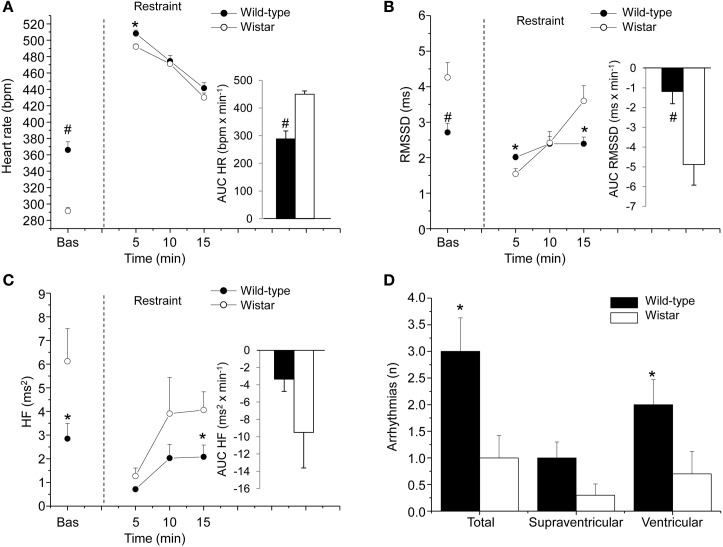
Figure 3.
Cardiac response to a restraint stress in 4-month-old Wild-type (n = 10) and Wistar (n = 10) rats. Panels (A–C) show the time course of changes in heart rate, RMSSD values, and high-frequency (HF, 0.75–2.5 Hz) spectral power, respectively, in baseline conditions (bas, 30 min) and during the restraint test (15 min). Each point during the restraint phase is the mean of 5-min intervals. Inner graphs in (A–C) represent the area under the response time curve above baseline (AUC) of heart rate, RMSSD, and HF values during the restraint phase. Panel (D) illustrates the incidence of cardiac arrhythmias during the restraint phase. Data analysis was conducted as described previously in detail (Carnevali et al., 2013a). Values are reported as means ± s.e.m. * and # indicate a significant difference between HAB and LAB rats (p < 0.05 and p < 0.01, respectively; Student's t-test).

