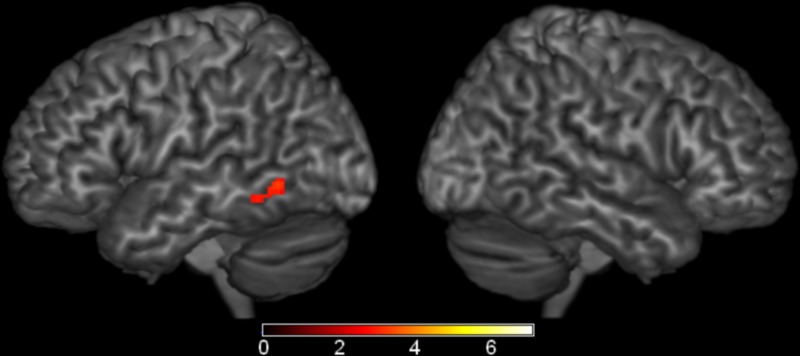
Figure 5.
Brain Activations: Semantic > Phonological. Areas in red represent the significant voxels within the left middle temporal gyrus region-of-interest where the semantic conditions elicited greater activation than the phonological condition. Activations are scaled in terms of significant Z-values, corrected p < 0.05.

