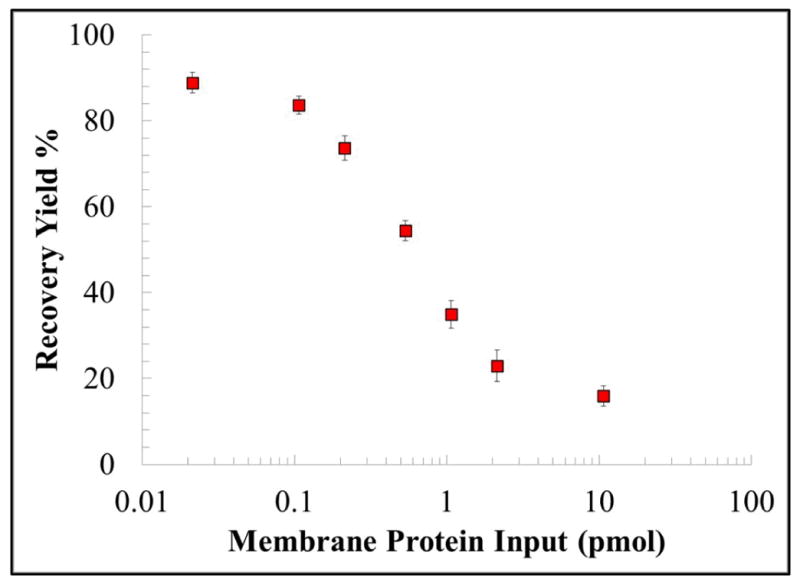
Figure 3.

The recovery of biotinylated MCF-7 membrane proteins loaded onto the μSPE device. The total amount of protein (pmol) before and after μSPE purification was estimated from fluorescence data, which measured proteins that were biotinylated. Error bars in the graph represent standard deviations from three replicate runs.
