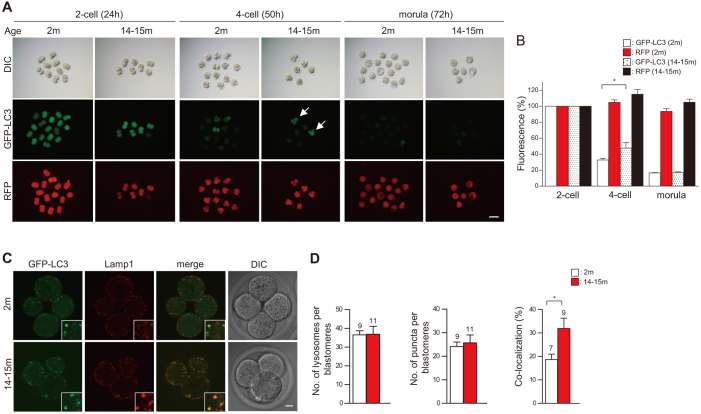
Figure 2. Decline of autophagic activity with advancing maternal age.
(A) Comparisons of GFP-LC3 and control RFP fluorescence during the development of embryos from young (2 months) and aged (14–15 months) mothers. Embryos that retained GFP-LC3 fluorescence are indicated by arrows. (B) Graph showing the total fluorescence intensities of GFP-LC3 and control RFP during embryonic development; values are expressed relative to the fluorescence at the 2-cell stage. Values are the mean ± s.e.m. of three different experiments, with more than 5 embryos analyzed per group. (C) Comparison of the localization of GFP-LC3 (green) and Lamp1 (red) between embryos from young and aged mothers. The insets show higher magnification images. (D) Comparisons of the number of GFP-LC3 puncta and lysosomes per blastomere between embryos from young and aged mothers, and of the percentage of co-localization of GFP-LC3 with lysosomes. Numbers of embryos analyzed are shown above the bars. Scale bars, 100 μm (A) and 10 μm (C). Error bars, s.e.m.; *P < 0.05 (Student's t-test).

