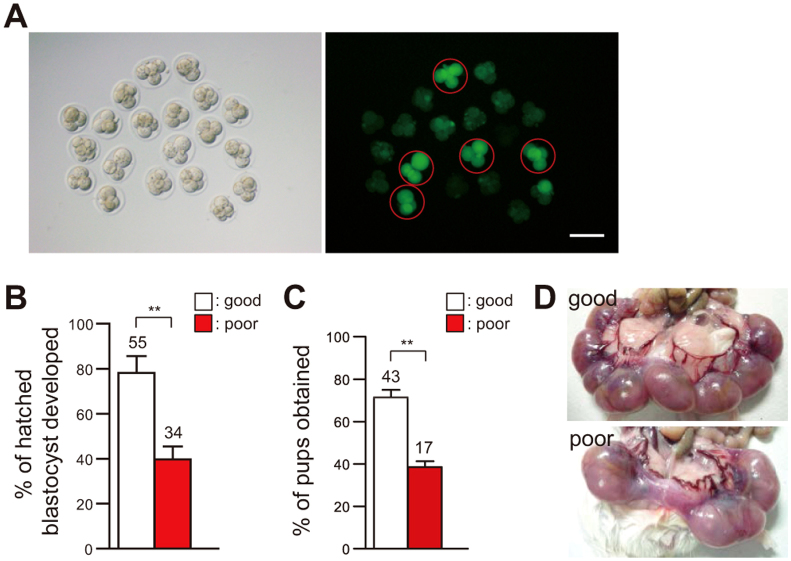
Figure 3. Autophagic activity is related to the developmental ability of the embryo.
(A) Categorization of 4-cell embryos into good or poor embryos based on GFP-LC3 fluorescence intensity. Embryos judged as poor are shown as red circles. Scale bars, 100 μm (B) Hatched blastocyst developmental rates of good and poor embryos. Numbers of embryos analyzed are shown above the bars. Error bars, s.e.m.; **P < 0.01 (Student's t-test). (C) Full-term developmental rates of good and poor embryos. Numbers of pups analyzed are shown above the bars. Error bars, s.e.m.; **P < 0.01 (Student's t-test). (D) Photograph showing embryonic development in Day 19 uteri of foster mothers that had received the same number of embryos categorized as good (upper) or poor (bottom).

