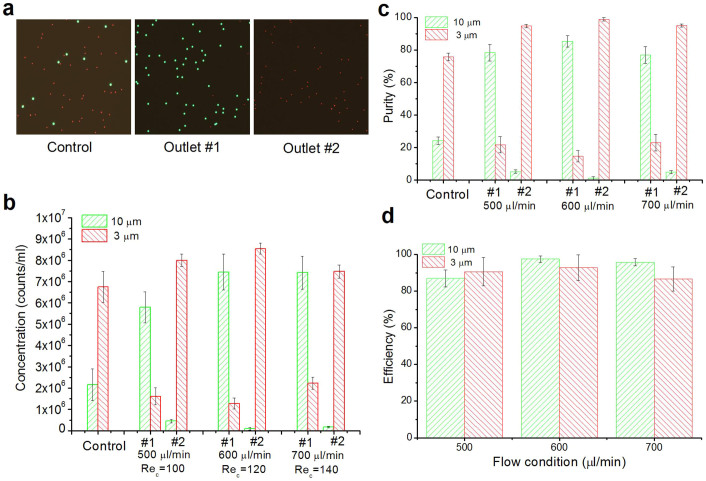
Figure 4. Separation of 3 μm and 10 μm particles in the serpentine channel.
(a) Fluorescent images of collections from control and two outlets. The control is particle mixture collected before passing through the serpentine channel. Pseudo-colored green and red dots represent 10 μm and 3 μm particles respectively. (b) Particle concentrations from control and two outlets under different processing flow conditions (flow rate or Reynolds number). (c) The purity of particles from two collectors at various flow conditions. (d) The separation efficiency for 3-μm and 10-μm particles under different flow conditions. Error bars represent the standard deviation of three measurements by hemocytometry.

