Figure 2.
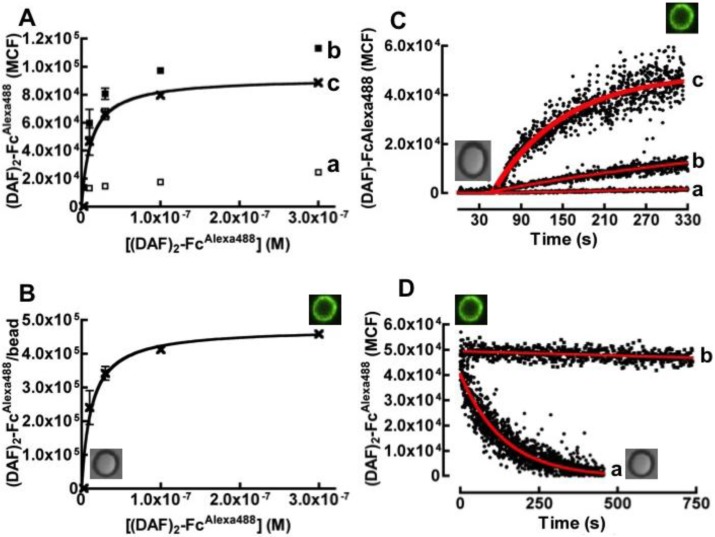
Equilibrium binding analysis of (DAF)2-FcAlexa488 to protein G beads. (A) Plot of bound (DAF)2-FcAlexa488 versus concentration of soluble (DAF)2-FcAlexa488. (a) Non-specific binding of various titers of (DAF)2-FcAlexa488 were mixed with 10,000 streptavidin coated beads in 20 µL, (b) Total binding and (c) Specific binding of (DAF)2-FcAlexa488 to 10,000 protein G beads. (B) Hyperbolic plot of (DAF)2-FcAlexa488 molecules/protein G bead versus concentration of soluble (DAF)2-FcAlexa488. The site occupancies were determined using Mean Equivalent of Soluble Fluorophores (MESF) standard calibration beads as described in the Experimental Section. The data were fit to simple Langmuirian binding curve to yield a Kd of 12 nM. (C) Kinetic analysis of binding of: (a) 2.43 × 10⁻¹° M, (b) 2.43 × 10⁻⁹ M, and (c) 2.43 × 10⁻⁸ M of fluorescently labeled (DAF)2-Fc to 40,000 beads in 400 µL by flow cytometry. The increase in bead-associated fluorescence over time was analyzed by the kinetic method of initial rates [30] to yield the following rate constants: (a) 6.90 × 10⁵ M−1s−1 (b) 5.16 × 10⁵ M−1s−1 (c) 6.71 × 10⁵ M−1s−1. (D) Dissociations of (DAF)2-FcAlexa488 from beads. (a) Dissociation kinetics induced by competition with a large excess of soluble Protein G added to molecular assembly. The data were fit to a single exponential decay curve to yield koff = 0.007 s−1. (b) The molecular assembly is relatively stable in the absence of a competitor. The square inserts are photographs of non-fluorescent and fluorescent beads or cells under different experimental conditions.

