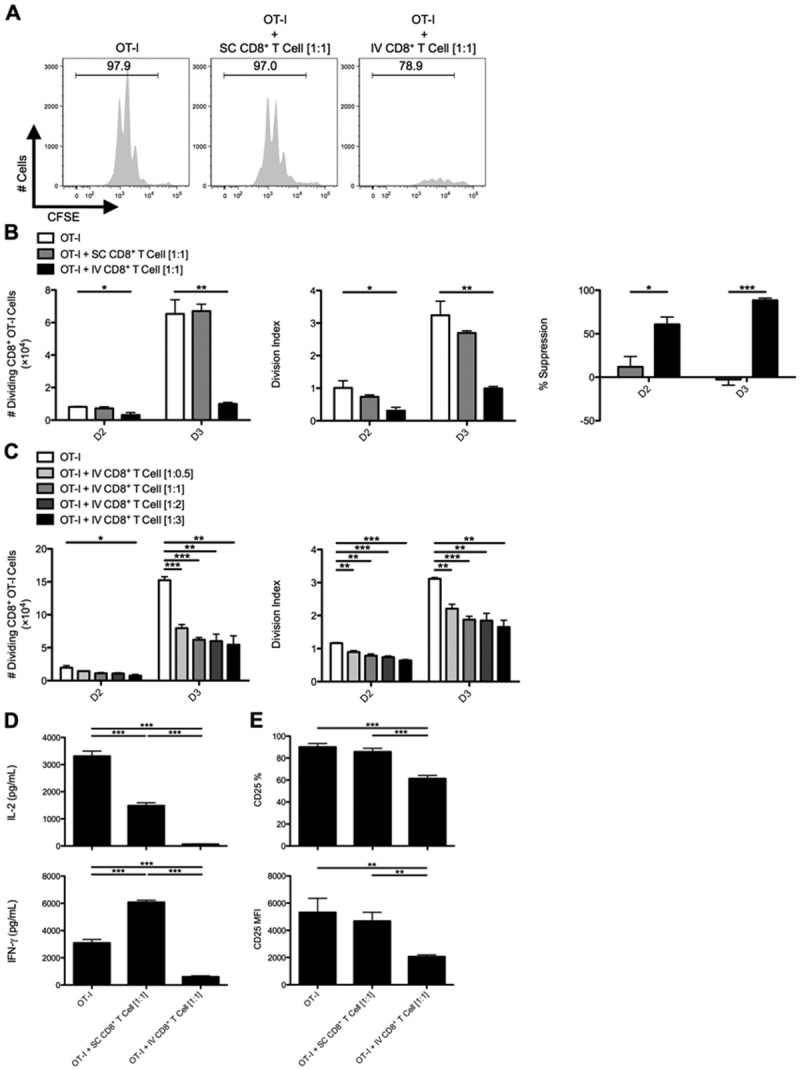
Fig 2.

CD8+ T cells from livers of IV-infected animals suppress the activation and expansion of naïve CD8+ OT-I T cells in vitro. C57BL/6 mice were SC or IV infected with 2.5 × 10⁷ IU of Ad-Ova, and (A) bulk CD8+ T cells were isolated from day 7 SC spleens and IV livers, then cultured with CFSE-labeled naïve Thy1.1+CD8+ OT-I T cells at a 1:1 ratio. SIINFEKL-pulsed BMDCs were used as the source of antigen, and cocultures were analyzed at day 3. (B) The number of dividing OT-I T cells, OT-I T cell division index, and percent suppression displayed by either SC CD8+ T cells or IV CD8+ T cells was calculated at days 2 and 3 of culture (one-way ANOVA/Tukey's posttest; n = 12 per group). (C) Naïve Thy1.1+CD8+ OT-I T cells were also cultured at various ratios relative to CD8+ T cells collected from livers of IV-infected mice (1:0.5, 1:1, 1:2, and 1:3; one-way ANOVA/Tukey's posttest; n = 3 per group). (D) Concentrations of IL-2 and IFN-γ were measured in the day 3 culture supernatants by ELISA, and (E) CD25 expression was determined directly ex vivo on day 3 Thy1.1+CD8+ OT-I T cells (one-way ANOVA/Tukey's posttest; n = 5-6 per group). Numbers in histograms represent percentages (mean ± standard error of the mean). *P < 0.05; **P < 0.01; and ***P < 0.001.
