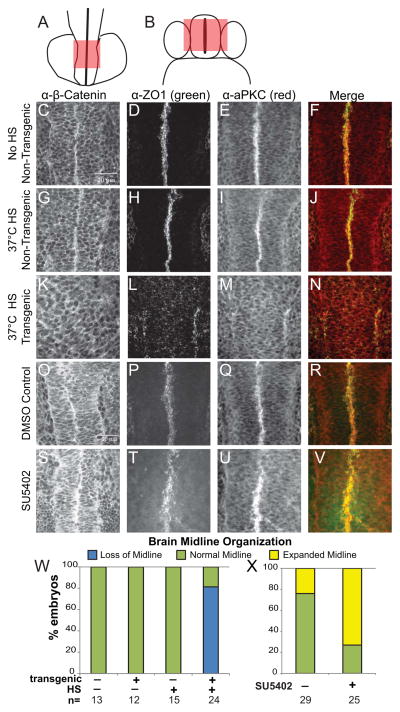
Figure 5. Brain midline morphology is disrupted when the balance of FGF signaling is altered.
(A) Dorsal view of a 14 somite embryo, red box indicates area imaged by confocal microscopy. (B) To orient the reader, a cross sectional view through the forebrain, red box corresponds to the z-stacks imaged by confocal microscopy. (C–V) Dorsal view of the brain of 16 somite embryos, anterior down, taken at 60X magnification. Z-stacks were taken to encompass the organized midline of the brain, except in the cases where the midline organization was absent and then z-stacks were taken over the entire brain. (C, G, K, O, S) Representative images of α-β-Catenin. (D, H, L, P, T) Representative images of α-ZO1. (E, I, M, Q, U) Representative images of α-aPKC. (F, J, N, R, V) Merged images of both α-ZO1 (green) and α-aPKC (red). HS activated transgenic caFGFR embryos (K–N) appear to lose cellular organization in the midline of the brain compared to non-HS’d controls (C–F) and HS’d non-transgenic siblings (G–J). SU5402 embryos appear to have an increase of midline staining (S–V) compared to DMSO controls (O–R). (W–X) Histograms showing frequency of loss of midline (loss of midline), WT midline (normal) and disorganized midline organization of caFGFR transgenics and siblings (W) and SU5402 and DMSO embryos (X). See Supplementary Table 1 for quantification of midline organization and quantification of markers used.

