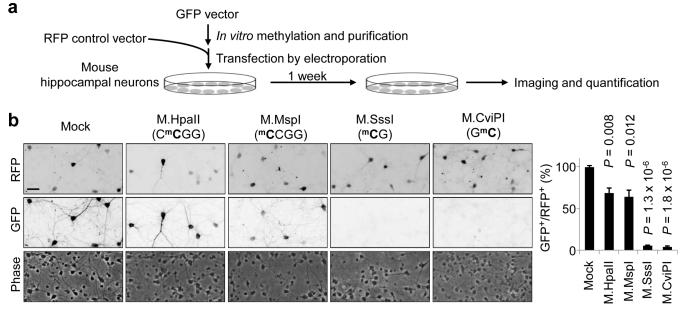
Figure 5. Repression of reporter gene expression by CpH methylation in neurons.
(a) A schematic diagram of experimental design of the in vitro methylated plasmid reporter assay. (b) Representative phase-contrast and immunofluorescent images of cultured hippocampal neurons co-transfected with an unmethylated RFP plasmid and GFP plasmids with different methylation patterns (left). Scale bar: 50 μm. Also shown is quantification of percentages of GFP+RFP+ neurons among all RFP+ neurons (right). Values represent mean ± s.e.m. (n = 3;P values are indicated for each condition; one-way ANOVA and Tukey’s test).

