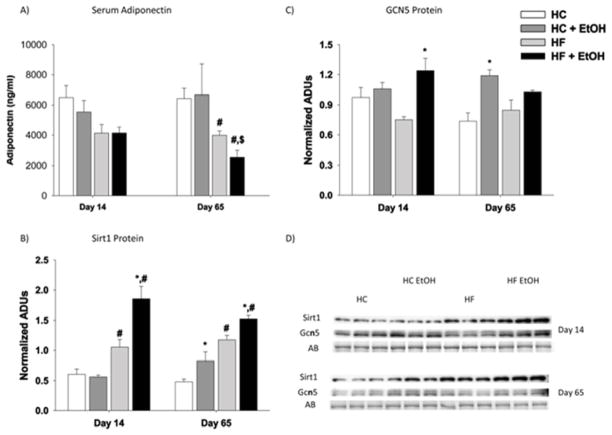
Figure 3.
Effects of dietary fat/carbohydrate ratio and ethanol on serum adiponectin and hepatic acylation/deacetylation pathways. A) serum adiponectin, B) immunoquantitation of SIRT-1 protein expression, C) immunoquantitation of GCN5 protein expression, D) Western immunoblots from day 14 and day 65 groups. Each lane represents a different animal, n = 3/group. AB – amido black stain loading control, HC – high carbohydrate, HF – high fat, EtOH – ethanol. Data are mean ± SEM. Statistical significance with regard to the effects of diet and ethanol at each time point was determined by two-way ANOVA followed by Student Newman-Keuls post hoc analysis. Means with # are significantly different by diet within the respective control or EtOH group; means with * are significantly different after ethanol treatment within each diet group, p < 0.05.

