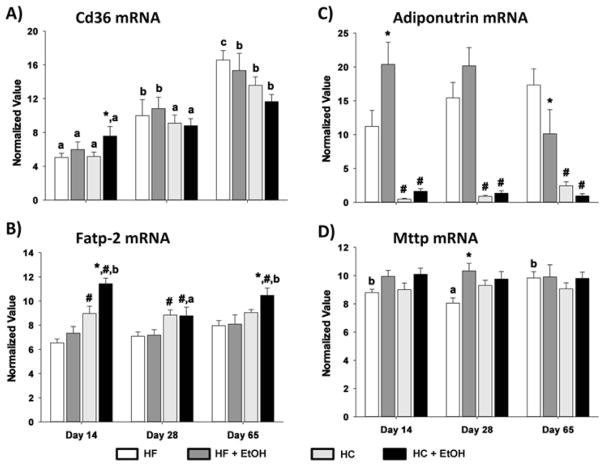
Figure 7.
Effects of dietary fat/carbohydrate ratio and ethanol on expression of mRNAs encoding enzymes in hepatic FA transport, triglyceride hydrolysis and VLDL secretion pathways. A) CD36, B) fatty acid transport protein 2 (Fatp-2), C) adiponutrin, D) microsomal triglyceride transport protein (Mttp). HC – high carbohydrate, HF – high fat, EtOH – ethanol. Data are mean ± SEM. Statistical significance for the effects of length of TEN feeding on each parameter was determined by one-way ANOVA followed by Tukey-Kramer post hoc analysis. Means with different letters are significantly different, a < b < c, p < 0.05. Statistical significance with regard to the effects of diet and ethanol within each time point was determined by two-way ANOVA followed by Student Newman-Keuls post hoc analysis. Means with # are significantly different by diet within the respective control or ethanol group; means with * are significantly different after ethanol treatment within each diet group, p < 0.05.

