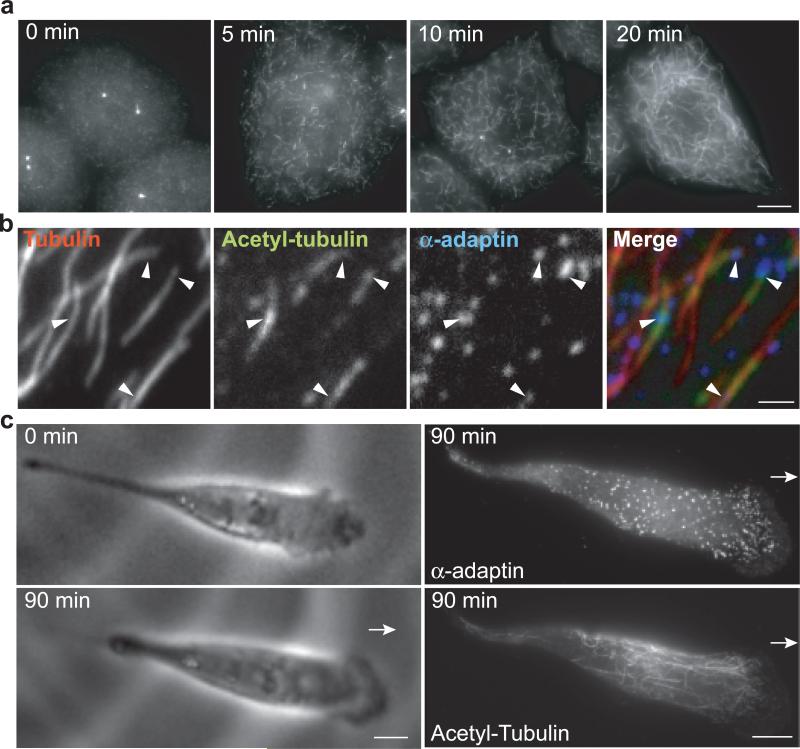
Figure 3. Spatial restriction of microtubule acetylation by CCP distribution.
a, b, HeLa cells stained for K40 acetyl-tubulin (a) or α-adaptin, total tubulin and acetylated-K40 (b) at the indicated times (a) or 5 min (b) after nocodazole washout. c, Live MDA-MB-231 cells imaged for 90 min (left panels) and then fixed and stained for α-adaptin and K40 acetyl-tubulin (right panels). Scale bars, 10 μm (a and c) and 2 μm (b).

