
Fig. 1.
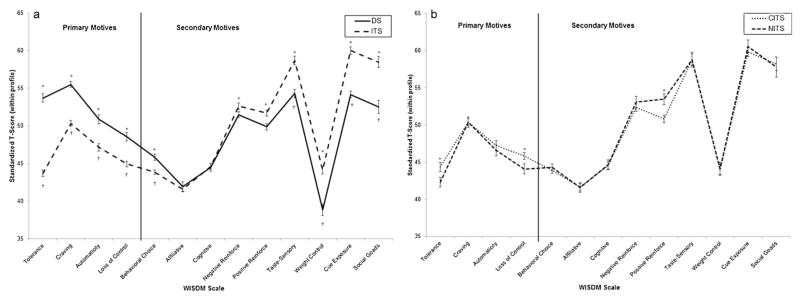
Profile of WISDM scores, standardized by each smoker’s mean and SD across the 13 scales of the WISDM, then scaled as T scores, with within-profile M = 50 and SD = 10. Scales are ordered by the size of the difference between DS and ITS. The vertical line and labels demarcate WISDM scales considered part of Primary Dependence Motives vs. Secondary Dependence Motives. (This classification had no role in the analysis, but is shown to indicate how the results map onto this classification.) (a) Profiles of DS and ITS differed significantly, based on a scale × group interaction in multivariate repeated-measures analysis (p < .0001). (b) Profiles of CITS and NITS did not differ significantly, based on a scale × group interaction in multivariate repeated-measures analysis (p > .35). However, some individual scale scores did differ, as indicated by asterisks. *p < .05 for individual scale comparisons between ITS and DS. †p < .05 for individual scale comparisons between CITS and DS.