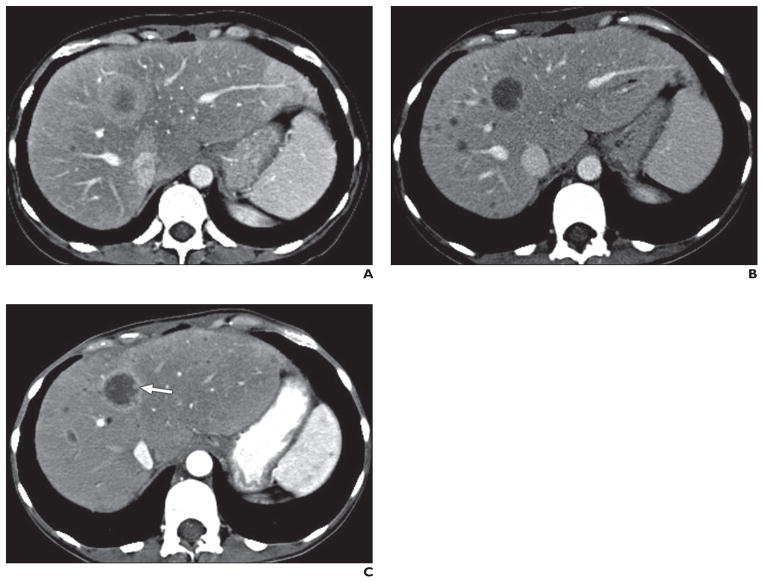
Fig. 8. 49-year-old woman with multiple liver metastatic lesions from pancreatic neuroendocrine tumor treated with sunitinib.
A, Baseline axial contrast-enhanced CT image shows large enhancing mass in segment IV of liver.
B, Follow-up contrast-enhanced CT image obtained 3 months after start of sunitinib treatment shows index mass in segment IV has decreased in size and attenuation, representing good response to treatment. However, multiple hypoattenuating nodules are newly apparent. Serum chromogranin A concentration decreased from 1090 to 210 U/L. Hence new liver nodules were considered pseudoprogression, and sunitinib treatment was continued.
C, Follow-up contrast-enhanced CT image obtained 14 months after start of sunitinib treatment shows reappearance of rim enhancement in index mass and development of several intratumoral nodules (arrow), representing true progression of tumor.

