
Figure 1. Myc induces glycolysis and reduces oxidative phosphorylation.
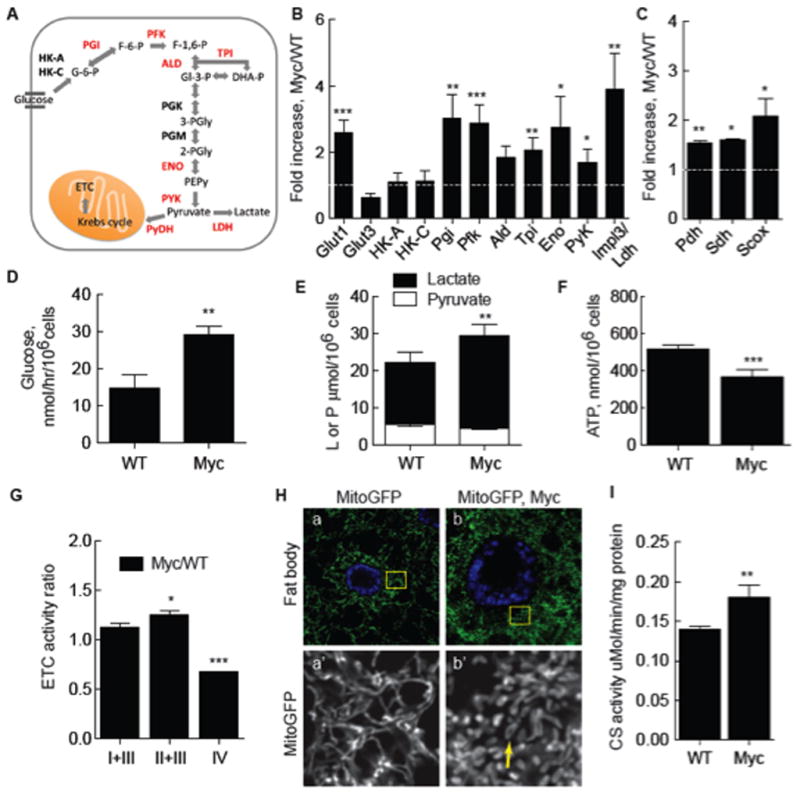
A. Schematic of glycolysis. Enzymes catalyzing reactions in glucose breakdown are bolded, those induced by Myc expression are red. See text for abbreviations.
B. Quantitative (q) RT-PCR of glycolytic gene expression in Myc cells from monocultures. mRNA expression is normalized to actin5C mRNA and shown as fold increase in Myc cells relative to WT cells. Significance is compared to expression in WT cells. All error bars in this figure are SD.
C. qRT-PCR of genes required for mitochondrial respiration, as described in B.
D. Glucose consumption in WT or Myc cell mono-cultures.
E. Intracellular lactate and pyruvate in mono-cultures of WT or Myc cells.
F. Steady-state ATP in WT or Myc cell mono-cultures.
G. ETC complex activity, normalized to CS activity, in Myc cells expressed as a ratio over activity in WT cells.
H. Mito-GFP-labeling of mitochondria in larval fat body cells shows mitochondrial morphology. a) WT cells. Area within each yellow square is magnified in single channel images below. b) WT Myc-expressing cells. Mitochondrial number and morphology are altered, with more donut shapes (arrow).
I. Citrate synthase (CS) activity, an index of mitochondrial mass, as a function of total cellular protein in WT and Myc cells from mono-cultures.