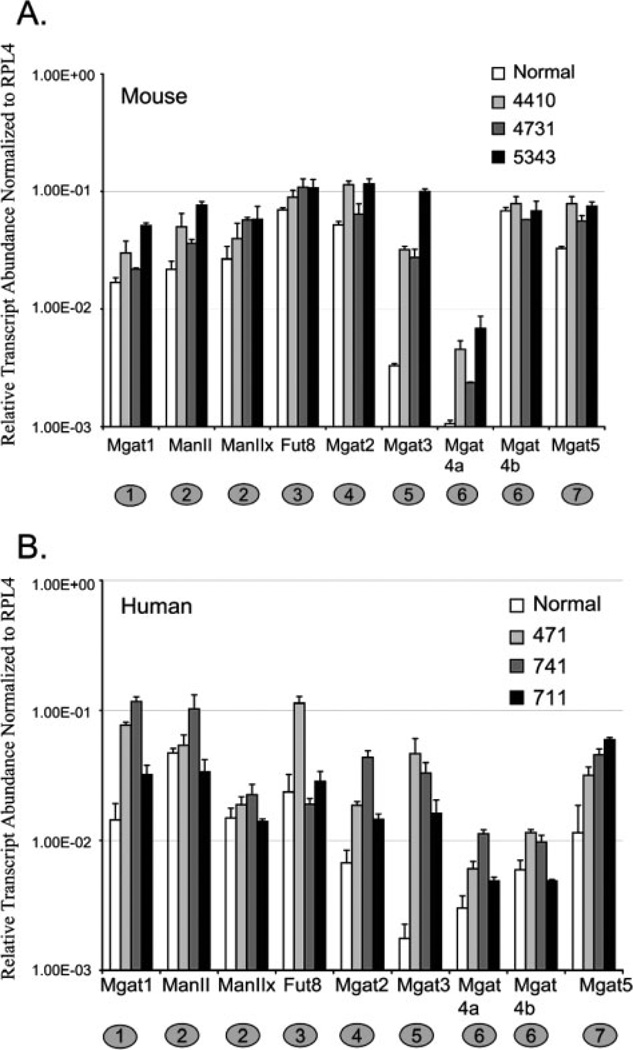
Figure 2.
Comparative analysis of normal and endometrioid ovarian carcinoma. (A) Relative transcript abundance for mouse normal and ovarian tumors plotted on a log scale. Error bars represent the SD from the mean for triplicate Ct values. (B) Relative transcript abundance for human normal and ovarian tumors plotted on a log scale. Error bars represent the SD from the mean for triplicate Ct values.

