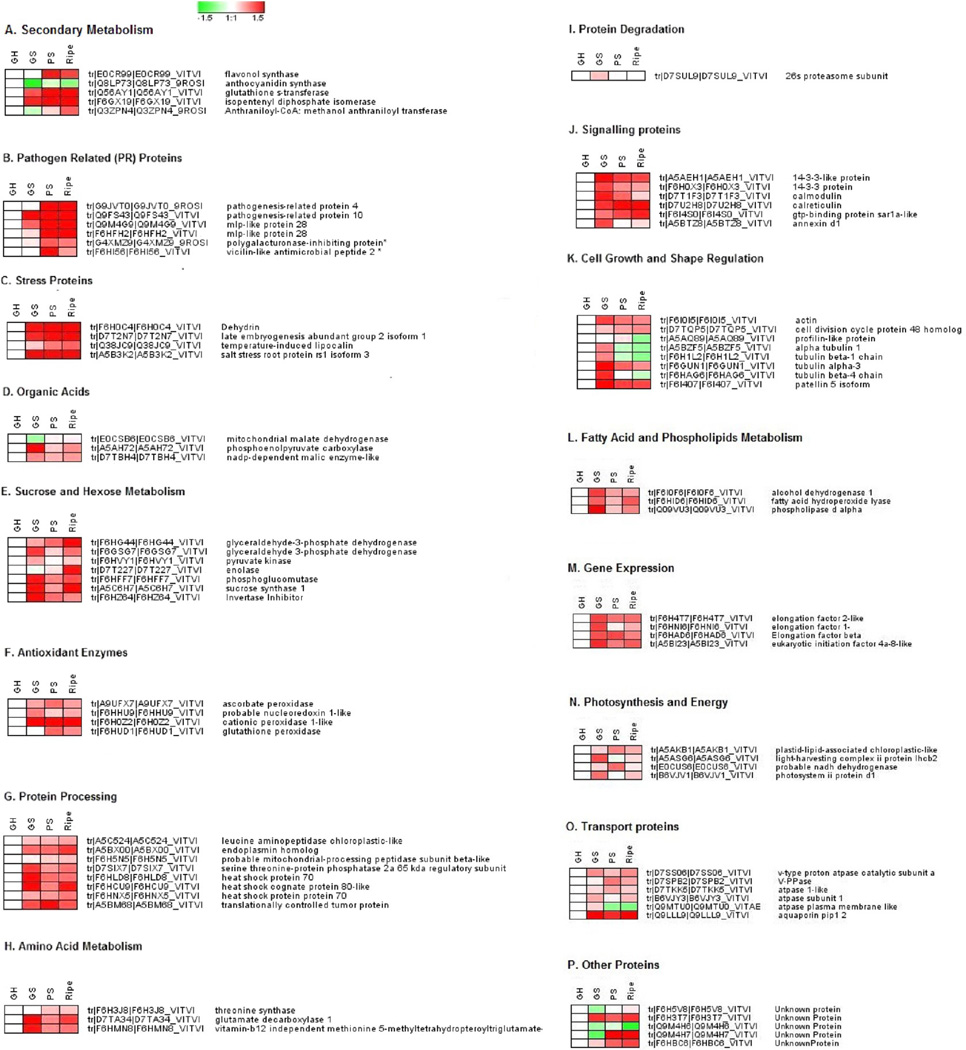
Figure 7.
Cluster profiles of protein functional clusters during muscadine grape berry ripening. A heat map of the log 2 relative abundance of proteins throughout ripening in relation to the green hard stage was created using Genesis v1.7 with the iTRAQ-derived quantitative data. For each protein, an abbreviation, the Uniprot accession number, and the sequence description assigned with Blast2GO are provided. Proteins were grouped according to their known or putative role in metabolic pathways or cellular process.

