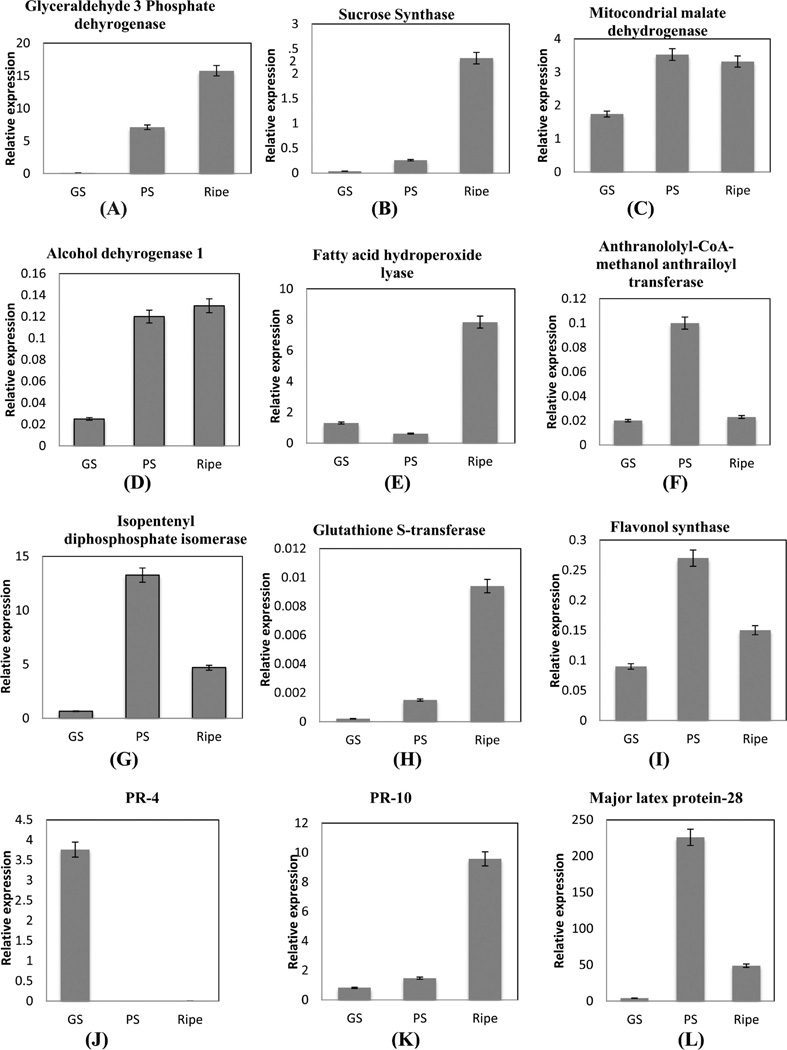
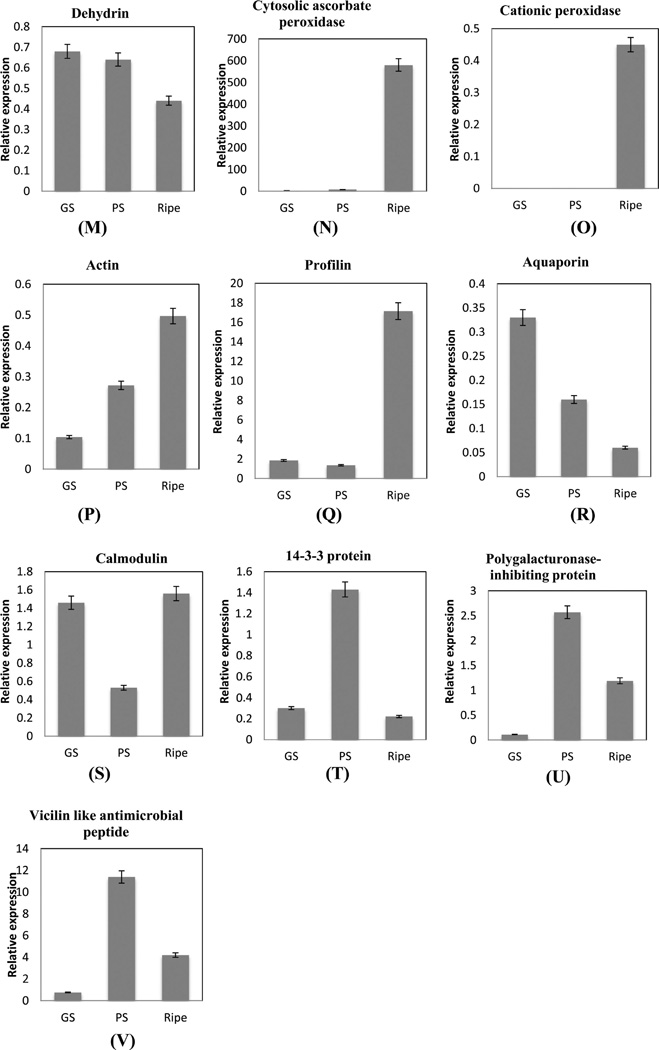
Figure 8.
Relative expression levels of transcripts. Data were normalized against expression of the housekeeping gene ubiquitin. To determine relative fold differences for each gene in each experiment, the Ct value of the genes was normalized to the Ct value for ubiquitin (control gene), and relative expression was calculated relative to a calibrator using the formula 2−ΔΔCt. All the values shown are mean ± SE.


