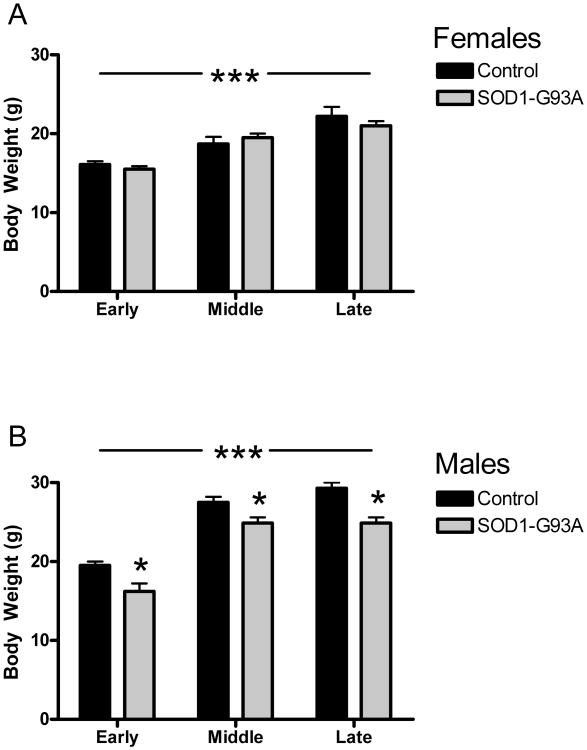
Figure 1.
Mean body weight in grams (± S.E.M.) for control and SOD1-G93A mice at early, middle and late stages. (A) Female mice exhibited age-related increases in body weight, but did not differ according to genotype. (B) Male mice exhibited age-related increases in body weight, but SOD1-G93A mice weighed less than control mice at each stage. *p < 0.05, ***p < 0.0001.

