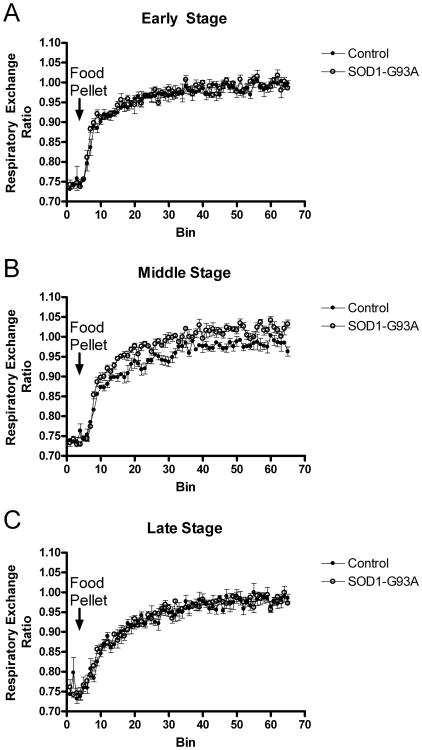
Figure 2.
Respiratory exchange as measured with indirect calorimetry in male control and SOD1-G93A mice at (A) early, (B) middle and (C) late stages. Each time bin = 4 min. Each graph shows the final seven time bins prior to feeding (pre-feeding respiratory exchange ratio values did not differ between the SOD1-G93A and control mice at any stage). At middle-stage, the SOD1-G93A mice exhibited a faster and greater post-feeding shift in the respiratory exchange ratio indicating greater carbohydrate metabolism at this disease stage. Respiratory exchange did not differ significantly between the SOD1-G93A and control mice during either early or late disease stages.

