
Figure 3.
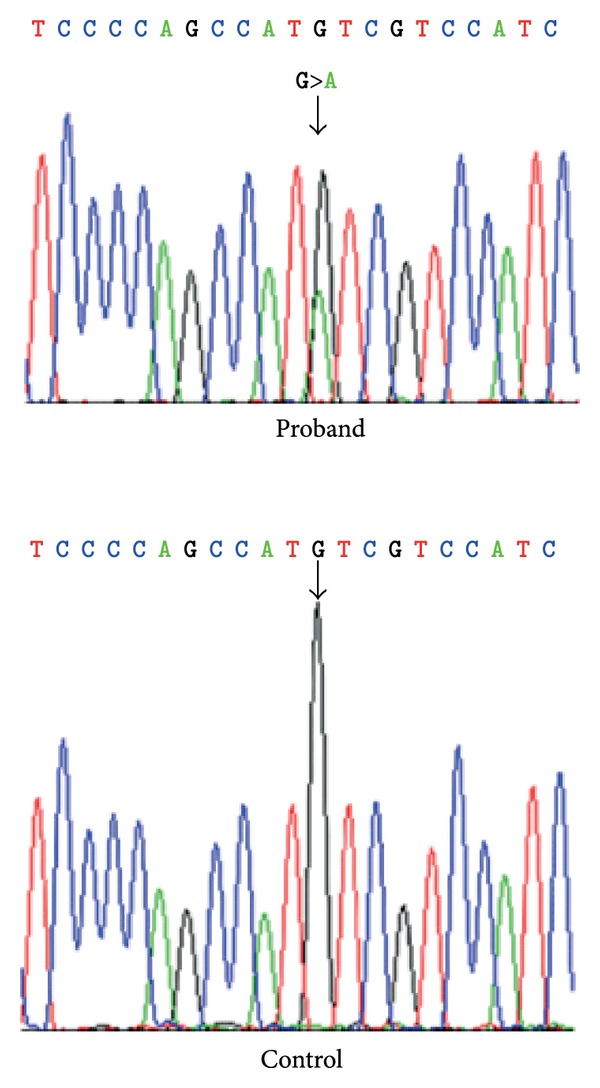
Sanger sequencing chromatogram revealing the pathogenic SMAD3 mutation, c.3G>A (p. Met1Ile) in the proband versus the normal sequence in a control.
Official websites use .gov
A
.gov website belongs to an official
government organization in the United States.
Secure .gov websites use HTTPS
A lock (
) or https:// means you've safely
connected to the .gov website. Share sensitive
information only on official, secure websites.
Sanger sequencing chromatogram revealing the pathogenic SMAD3 mutation, c.3G>A (p. Met1Ile) in the proband versus the normal sequence in a control.