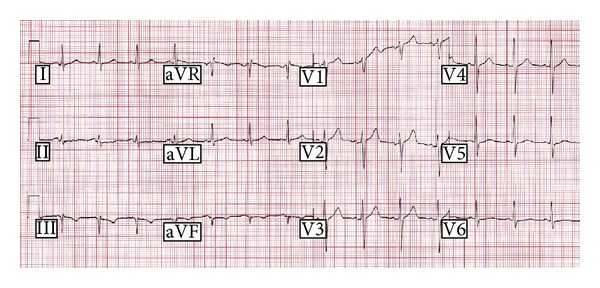
Figure 2.

12-lead electrocardiagram of the deceased's father. The ST-T segment is unusual and very flat in lead II, such that determining the end of the T wave is difficult. In lead I, R-R is 690 ms, QT is 396 ms, and QTc is 477 ms. In lead V5, R-R is 711 ms, QT s 391 ms, and QTc is 464 ms; the T wave is of low amplitude with a slight double bump morphology.
