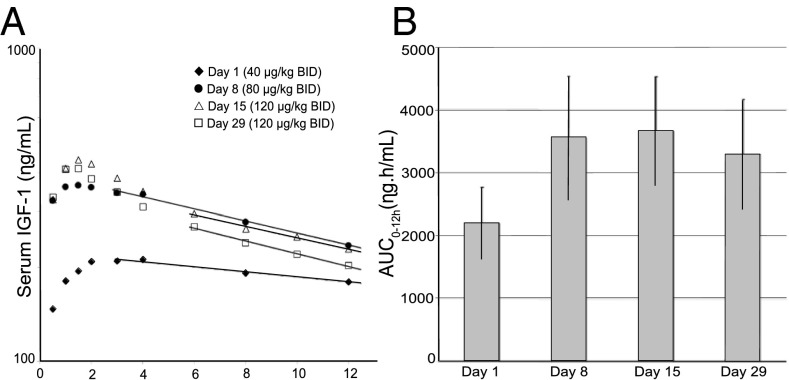
Fig. 2.
(A) Serum IGF-1 concentrations show a log-linear terminal phase 4–6 h after dosing. Serum IGF-1 concentrations were analyzed by a noncompartmental analysis comparing escalating doses at days 1, 8, 15, and 29. A log-linear terminal phase was observed after 4–6 h postdosing. The slopes of decay allowed the estimation of t1/2,λ and MRTb are described in Table S1. (B) As shown, the mean and SE of the AUCt of IGF-1 suggests nonlinear kinetics. The AUCt up to the last observation lacked dose proportionality, suggesting a nonlinear kinetics. The lowest dose of 40 μg/kg BID dose elicited a mean AUCt = 2,050 ng⋅h/mL whereas the area for twice that dose (80 μg/kg BID) incremented just about 75%. When the lowest dose was tripled (120 μg/kg BID) at day 15, the increment was nearly the same. The Mean and SE of the AUCt in serum and CSF are shown.

